Repository navigation
Style Bubble
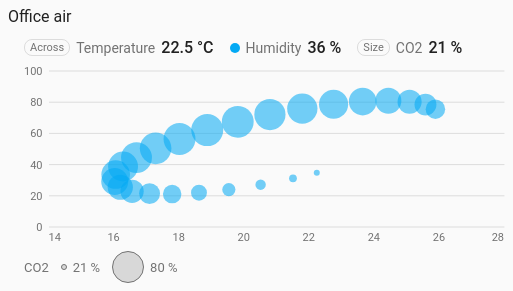
A scatter where a third sensor sets the size of each dot: temperature along the bottom, humidity up the side, and CO2 as the size of each bubble. It is a history chart like Line, and shares its period, calendar spans, previous and next buttons, statistics, grouping, axes and compact layout.
Three related readings at once, where the third tells you how much each moment matters: air quality, energy use against temperature and occupancy.
type: custom:chartdeck-card
style: bubble
title: Office air
group_by: hour
entities:
  - entity: sensor.office_temperature
    name: Temperature
  - entity: sensor.office_humidity
    name: Humidity
  - entity: sensor.office_co2
    name: CO2
To use this style, set style: bubble (or pick Bubble under Distributions in the editor's Style section). The chart options are in the editor's Chart section.
- The first entity goes along the bottom, the second up the side, and the third sets each bubble's size. The header marks them Across and Size.
- The three are paired in time as the scatter chart does: at every moment any of them changed, each one's value is the last it reported. Moments when one was unavailable or hadn't reported yet are left out.
- A bubble's area, not its width, grows with the size reading, from the smallest bubble at the lowest reading in view to the largest at the highest. Twice as far up the range covers twice as much of the chart.
- Larger bubbles are drawn first so small ones stay on top, and all are half see-through.
-
Period: the last 24 hours when
periodisn't set, as on the line chart.
min_size: 6     # px, 2 to 80 (default 6): the smallest bubble
max_size: 32    # px, 2 to 80 (default 32): the largest; not below min_size
jitter: 0       # px, 0 to 20
x_min: 15       # fixed range along the bottom
x_max: 28-
Grouping by hour or day (
group_by) gives one bubble per group, which keeps a busy sensor from burying the chart. - A legend under the chart shows the smallest and largest bubble with the readings they stand for.
- At most 400 bubbles are drawn; more are thinned evenly.
- The bubble colour is the second entity's
color.
Hovering or touching the chart picks the nearest bubble and shows all three readings and the time.
In the editor: Smallest bubble (px), Largest bubble (px), Jitter (px), Lowest value across, Highest value across and Labels along the bottom. Each entity has a Dot colour.
With fewer than three entities the chart shows a message saying what to add. A missing or unavailable size entity leaves no bubbles.
The period, calendar spans, source, grouping, axes, gridlines and compact layout are the same as on the line chart. See Line for each one.
Layout: one chart for the whole card. Every shared option is described on the Options page.
Previous: Scatter · Next: Heatmap · All styles