Repository navigation
Math Stellar Photometry
Astronomers measure how bright a star looks with a logarithmic scale of magnitudes, a historical accident that turned out to match the eye. isotop borrows the scale wholesale: memory is the star's brightness, 1 GiB is magnitude 0, and src/stellar.rs turns a magnitude into a
sharp core inside a soft halo and turns births and exits into flashes. View Ptolemy draws every steady process as such a star, and the sky of View HR builds on the same module. This page derives the magnitude scale, explains the point-spread function behind the "star" look, lists exactly
what the code does and where it saturates, and compares the nova, fade and supernova timelines with the real things.
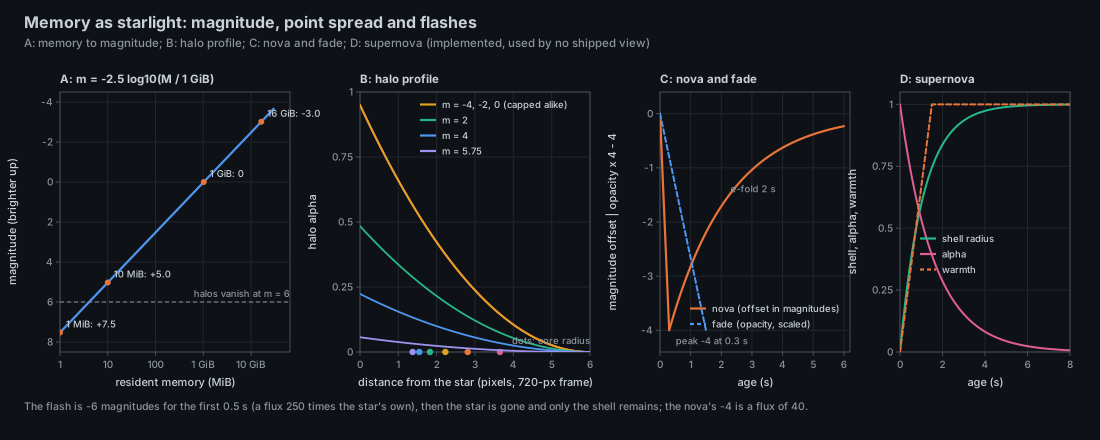
A: magnitude against memory. B: the halo's alpha profile of stars of several magnitudes in a 720-pixel frame; the dots are core radii. C: nova and fade. D: supernova shell. Script: docs/figures/stellar-photometry.py, which re-implements the formulas of stellar.rs.
The scale runs backwards because it began as a ranking. Hipparchus (2nd century BCE) is generally believed to have sorted stars into brightness classes in a catalogue that is lost, so the attribution cannot be proved; the surviving text of his that mentions star brightness describes it in words, not numbers. Ptolemy's catalogue in the Almagest (about 150 CE) is what made the six classes known: the brightest stars were first magnitude, the faintest visible to the naked eye sixth. Nothing in that scheme was logarithmic, and the classes were not equal steps of anything measured.
Measurement turned the ranking into a law. In the 19th century photometers showed that a star of first magnitude gave roughly a hundred times the light of one of sixth magnitude. In 1856 Norman Pogson proposed making that exact: five magnitudes is a flux ratio of exactly 100, one magnitude a ratio of
Brightness curves of the kind in the code section have their own histories. The word nova comes from the title of Tycho Brahe's 1573 book on the new star of 1572, which was in fact a supernova; the two kinds of event were not told apart for centuries. Cecilia Payne-Gaposchkin's The Galactic Novae (1957) is the classification the page cites. The Hertzsprung-Russell diagram (Hertzsprung 1911, Russell 1913) is the other half of this page's astronomy and belongs to the HR view.
The Greeks sorted the naked-eye stars into six classes of brightness; Ptolemy's star catalogue in the Almagest (about 150 CE) lists them by class, first magnitude brightest and sixth faintest. Modern photometry found that the eye is roughly logarithmic, and that a first-magnitude star is about a hundred
times brighter than a sixth-magnitude one. Pogson (1856) made the convention exact: five magnitudes is a flux ratio of exactly 100, so one magnitude is a ratio of
so smaller is brighter, and a 10-fold flux ratio is 2.5 magnitudes. An absolute scale needs a zero point: historically a star of magnitude 0 (Vega, approximately) defines it. The scale is the logarithm of the physical quantity, which is why it spans the enormous range from the Sun (
The apparent magnitude
A telescope never images a point source as a point. The image is the instrument's point-spread function (PSF): for a circular aperture of diameter
with a first dark ring at
- A nova is a white dwarf in a binary that ignites accreted hydrogen: a rise of many magnitudes in about a day, then a decline over weeks to months, classified by
$t_2$ and$t_3$ , the times to fall 2 and 3 magnitudes from maximum (Payne-Gaposchkin, 1957). - A supernova is a stellar explosion that can outshine its host galaxy; its debris shell expands, and in the adiabatic (Sedov-Taylor) phase the radius grows as
$R \propto (Et^2/\rho)^{1/5} \propto t^{2/5}$ (Taylor 1950; Sedov 1959). - The Hertzsprung-Russell diagram (Hertzsprung 1911; Russell 1913) plots stellar luminosity (or absolute magnitude) against temperature or spectral class; stars fall in bands (the main sequence, giants, white dwarfs). View HR places processes on such a diagram.
All in src/stellar.rs, and every constant follows the star and supernova blocks of the prototype docs/mockups/code/hr.py.
Magnitude. magnitude(memory) is f64:
| Memory | Magnitude | Flux relative to 1 GiB |
|---|---|---|
| 1 MiB (the floor; also kernel threads, which have none) | +7.53 | 0.001 |
| 10 MiB | +5.03 | 0.0098 |
| 100 MiB | +2.52 | 0.098 |
| 1 GiB | 0 | 1 |
| 16 GiB | -3.01 | 16 |
A doubling of memory is FLUX_ONE_MAGNITUDE).
Spread. spread(magnitude, frame_height) returns the pixel sizes and strengths of the two layers. With
| Quantity | Formula | Limits |
|---|---|---|
| Core radius (pixels) |
|
|
| Core strength | at most 2.2 (the core colour is scaled by it, saturating towards white) | |
| Halo fade | halos fade out between |
|
| Halo strength |
|
0 to 0.95 |
| Halo radius (pixels) | at most |
Frame::star draws one pickable sphere of the core radius, in the star's colour mixed 60 % towards white and scaled by the core strength, and at most one glow of the halo radius and strength (the CPU halo draws strength
Evaluated at a 720-pixel frame:
| Memory | m | Core radius | Core strength | Halo radius | Halo strength |
|---|---|---|---|---|---|
| 1 MiB | 7.53 | 1.25 px | 0.71 | none | 0 |
| 10 MiB | 5.03 | 1.44 | 0.91 | 6.0 | 0.15 |
| 64 MiB | 3.01 | 1.67 | 1.22 | 6.0 | 0.33 |
| 256 MiB | 1.51 | 1.91 | 1.60 | 6.0 | 0.59 |
| 1 GiB | 0 | 2.23 | 2.16 | 6.0 | 0.95 (cap) |
| 4 GiB | -1.51 | 2.64 | 2.20 (cap) | 6.0 | 0.95 |
| 16 GiB | -3.01 | 3.20 | 2.20 | 6.0 | 0.95 |
Two consequences follow from the constants and are visible in panel B. The halo radius is already at its 6-pixel cap for
Flashes. flash(kind, age_seconds) depends only on the age (a caller keeps its own birth and exit times, so it is stateless and replays identically at any frame rate):
-
Nova (a birth): the magnitude offset falls linearly to
$-4$ over 0.3 s (a flux of$10^{1.6} = 40$ times the star's own), then$-4,e^{-(t - 0.3)/2}$ with an e-folding time of 2 s, and the flash is over at 6 s. Note that the magnitude offset decays exponentially, not the flux; the offset falls to$-2$ at$0.3 + 2\ln 2 = 1.69$ s (a "$t_2$" of 1.39 s from maximum, against days to months for a real nova). -
Fade (an ordinary exit): opacity
$1 - t/1.5$ , linearly, then gone. -
Supernova (an exit of more than 1 GiB, chosen by
exit_flash):$-6$ magnitudes (a flux of 251) linearly over 0.5 s, after which the star is not drawn at all (opacity 0) while a shell grows as$1 - e^{-t/1.1}$ of its final radius, fades with alpha$e^{-t/1.6}$ , and warms from blue-white to red as$\min(t/1.5, 1)$ ; over at 8 s. The shell's saturating exponential is a stylisation: a real remnant expands as a power law in time.
Who uses it. View Ptolemy draws fixed stars with magnitude, spread and Frame::star, flashes births as Flash::Nova and fades exits with Flash::Fade. The supernova timeline and exit_flash are used by View HR, which draws a supernova for an exit above 1 GiB and a fade below it.
Nothing else in isotop uses the magnitude scale; other views size by their own saturating curves (see model::bounded).
- Measured: memory (RSS; the physical footprint on macOS) is the only input to a star's brightness; birth and exit times (from consecutive samples of the shared history) drive the flashes.
- Derived: the magnitude, the core and halo sizes, the colour mix toward white.
- Decorative: the colour of a star (the process's kind) is not a temperature: there is no spectral information. In View HR a temperature comes from CPU use; here colour carries kind only.
- Saturation. Brightness is compressed twice, by the logarithm and by the display's caps: the visible range is about 1 MiB (core 1.25 px, no halo) to about 1 GiB (halo strength at its cap), 7.5 magnitudes or ten doublings; below about 6 MiB there is no halo, above 1 GiB almost nothing changes.
-
Flashes are age-only. A nova at 0.3 s is
$-4$ magnitudes whatever the process; a supernova needs more than 1 GiB (not 1 GiB exactly). A short-lived process appears and fades inside the 8 s window the view looks back over; a process that exits and whose exit lies outside that window is not shown fading. - Size means flux^0.2, not area. The core radius grows as the fifth root of flux (a factor 1.58 per 2.5 magnitudes at the bright end), so a thousand-fold memory ratio is a factor of four in the scaling part of the radius.
./target/release/isotop --demo --view ptolemy --time 300 --width 1600 --output /tmp/stars.png --renderer cpu
cargo test stellar     # the tests are the specification: magnitude, spread, nova, fade, supernova
python3 docs/figures/stellar-photometry.py
Watch the outer ring of the Ptolemy view in the live demo for a newly started process: a nova flares for six seconds, brightest in the first one or two.
-
src/stellar.rs:magnitude,spread,Spread,Frame::star,Flash(Nova,Fade,Supernova),exit_flash,flash,FlashState,Shell; constantsFLUX_ONE_MAGNITUDE,REFERENCE_HEIGHT,CORE_LIMITS,HALO_*,CORE_STRENGTH_LIMIT,CORE_WHITENING,NOVA_*,FADE_SECONDS,SUPERNOVA_*,SHELL_*. -
src/ptolemy.rs:draw_starand the exits loop (the only callers);src/render.rs:Item::Sphere,Item::Glowand the CPUhalo(alpha$\propto(1 - d)^2$ );src/palette.rs:mix,tint. - Tests in
stellar.rs:one_gibibyte_is_magnitude_zero_and_ten_mebibytes_is_five,memory_below_one_mebibyte_is_floored,brighter_stars_are_never_smaller,halos_are_capped_and_absent_for_faint_stars,a_nova_peaks_early_and_is_gone_after_six_seconds,only_exits_above_one_gibibyte_go_supernova,a_supernova_shell_grows_monotonically_and_fades. - Design:
docs/briefs/views-2026-10.mdsection 5 (hr),docs/mockups/code/hr.py.
- Colour as temperature. Map CPU use to a blackbody colour, as View HR does; the star's colour would then carry a measurement.
- Twinkle. View HR makes a star's twinkle amplitude the coefficient of variation of its CPU: scintillation as a stability measure.
- Constellations. Join the stars of a cgroup with stick figures, as View HR does; the figure's legibility depends on the halo cap above.
- Lift the cap. Let the halo radius keep growing with flux until the core and halo strengths saturate, restoring a visible difference between 1 and 16 GiB.
- Real light curves. Use a power-law decline (linear in magnitude) for the nova; the current exponential-in-magnitude decay is flatter at late times.
-
The Sun. Solving
$-2.5\log_{10}(\text{memory}/1,\mathrm{GiB}) = -26.7$ gives about$5.1\times10^{19}$ bytes, 2.8 times a 64-bit address space.magnitudetakes au64, so the brightest star it can draw is$-25.6$ , at a memory of$2^{64}$ bytes; no process can outshine that, and none can be the Sun. - Open: is a logarithm of memory the right "luminosity"? Resident memory is not a flux (it does not add over time): a process's memory-seconds would be.
- N. R. Pogson, "Magnitudes of thirty-six of the minor planets for the first day of each month of the year 1857", Monthly Notices of the Royal Astronomical Society 17 (1856), 12-15.
- G. J. Toomer (transl.), Ptolemy's Almagest (Duckworth, 1984), the star catalogue and its six classes.
- A. F. J. Moffat, "A theoretical investigation of focal stellar images in the photographic emulsion and application to photographic photometry", Astronomy and Astrophysics 3 (1969), 455.
- S. S. Stevens, "On the psychophysical law", Psychological Review 64 (1957), 153-181.
- C. Payne-Gaposchkin, The Galactic Novae (North-Holland, 1957).
- G. I. Taylor, "The formation of a blast wave by a very intense explosion", Proceedings of the Royal Society A 201 (1950), 159-186; L. I. Sedov, Similarity and Dimensional Methods in Mechanics (Academic Press, 1959).
- E. Hertzsprung (1911) and H. N. Russell (1913) on the luminosity-spectral-type relation (details of the original papers unverified here).
- View Ptolemy, View HR, Math Fourier Epicycles, Theory Colour, Theory Rasterization.