Repository navigation
Planned Mold
Planned, not yet implemented. Specified in docs/briefs/views-2026-10.md and tracked in issue #41.
The mold view is specified as a Petri dish of dark agar in which a glowing yellow slime mold wires up the busy processes. Each process is an oat flake; the flake's area follows its memory and the attractant it emits follows its CPU. A fine fractal fringe explores the empty agar, thick veins settle between the flakes that the mold decides are worth joining, and a vein thins and retracts over seconds when a flake's process exits. This page is the theory of the organism and of the two models behind the picture (Tero's continuum model and Jones's particle model), followed by the design as it is currently written down. Nothing here exists in the source tree yet: isotop --list-views does not list mold, and every statement in the Design section is a specification, not behaviour.
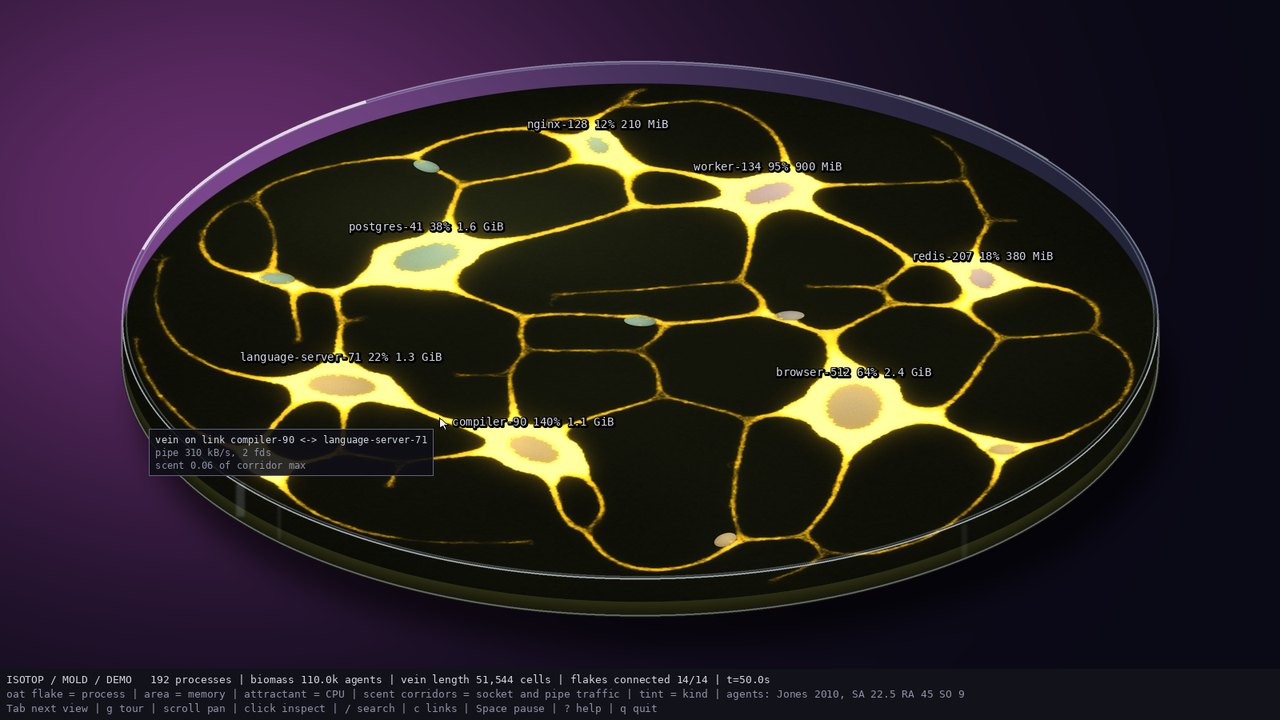
The reference mockup (docs/mockups/mold.jpg), rendered in Python by docs/mockups/code/mold.py from synthetic data. It is the visual target, not an isotop render.
Physarum polycephalum is a plasmodial slime mold. In its feeding stage it is a single, very large, multinucleate cell: a sheet of cytoplasm that, on a dish, organises itself into a network of tubes. Cytoplasm is driven back and forth through the tubes by rhythmic contractions of the tube walls (shuttle streaming, with a period of the order of a minute or two), and the tubes are not fixed: a tube that carries a lot of flow thickens, and a tube that carries little thins and disappears. Laboratory cultures are fed on oat flakes on agar, which is where the picture of a mold wiring up scattered "food" comes from.
Two experiments made the organism a standard example of computation without a brain.
- The maze. Nakagaki, Yamada and Tóth (2000) let a plasmodium fill a maze, then offered food at two exits. The organism retracted from the dead ends and left a tube along the shortest path between the two food sources.
- The Tokyo rail network. Tero and colleagues (2010) placed oat flakes on a map of the Greater Tokyo area at the positions of cities and let a plasmodium connect them. They reported that the resulting network had efficiency, fault tolerance and cost comparable to those of the real rail system, and they extracted a mathematical model of the mechanism that reproduces this. The abstract of the paper says the core mechanisms of adaptive network formation "can be captured in a biologically inspired mathematical model that may be useful to guide network construction in other domains".
Why this is a good metaphor for process data. The machine has scattered sources of activity (processes, each with a CPU load and a memory footprint) and a sparse set of real connections between them (sockets, pipes). A slime mold is a mechanism that, given sources of "food" at fixed places and some structure in between, produces a transport network that is thin where nothing flows and thick where much does, and rebuilds itself when a source appears or vanishes. The metaphor is structural and aesthetic. It is not a claim that the veins are measured traffic: see Reading the picture.
The slime moulds were first taken for fungi, because the organism ends its feeding life as stalked, spore-bearing fruiting bodies. They were later grouped with the protozoa and are now placed in the Amoebozoa (class Myxogastria), with Physarum polycephalum in the order Physarales. A 2012 study in BMC Evolutionary Biology found the genus Physarum to be polyphyletic, so the classification is still being redrawn.
Its career as a computing medium began at Hokkaido University. In 2000 Nakagaki, Yamada and Tóth published the maze experiment in Nature; in 2007 Tero, Kobayashi and Nakagaki turned the observation into a mathematical model of adaptive transport, the conductivity equation above. The Tokyo rail experiment and its generalised model appeared in Science in 2010. Popular accounts date the Tokyo experiment to 2009 or to 2010; the paper is the authority for the second.
The two experiments were each recognised by an Ig Nobel Prize: in 2008, for cognitive science, to the maze team (Nakagaki, Yamada, Tóth, Tero, Kobayashi and Ishiguro), and in 2010, for transportation planning, to the Tokyo team, which added Takagi, Saigusa, Ito, Yumiki, Bebber and Fricker. Nakagaki is named in both citations.
The continuum model then acquired a mathematics of its own. Jones (2010) showed that a swarm of local agents on a trail map reproduces the networks without ever building a graph, which is the model this view is specified to run. Adamatzky's Physarum Machines (2010) collected the organism's use as a computing substrate, and Bonifaci, Mehlhorn and Varma (2012) proved that the linear form of the model computes shortest paths. Each of these is a model of the organism's behaviour; none of them is evidence about processes, and the view claims nothing of the kind.
For a Newtonian fluid of viscosity
Collecting the factors that belong to the tube into a conductivity
The fourth power matters. Doubling a tube's radius multiplies its conductivity by sixteen, so a tube that is slightly wider than its neighbour carries much more of the flow, which is the physical root of the winner-take-all behaviour below.
Let the network have nodes
This is a linear system $\mathbf{L}D,\mathbf{p} = \mathbf{b}$ whose matrix is a weighted graph Laplacian: symmetric, positive semidefinite, with the constant vector in its kernel. Fixing the pressure of the sink at zero makes it nonsingular on a connected network, so the pressures, and then every $Q{ij}$, follow from one linear solve. The solve is the expensive step of the continuum model, and it is repeated every time the conductivities change.
The model's second ingredient is the rule by which a tube's conductivity responds to the flux it carries (Tero, Kobayashi and Nakagaki 2007; Tero et al. 2010):
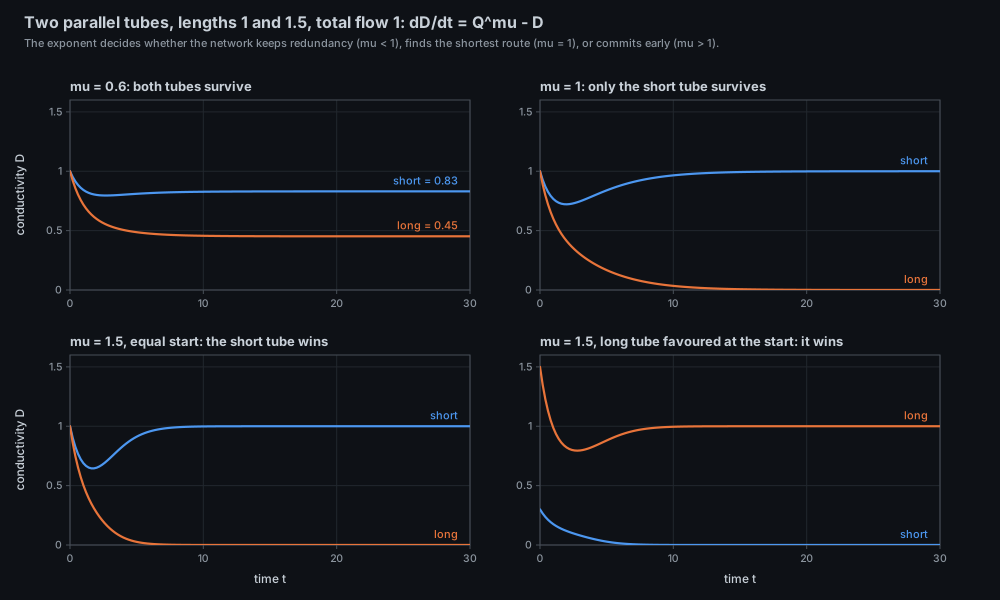
The smallest network with a decision in it has one source, one sink and two parallel tubes of lengths
Take
The ratio
-
$\mu < 1$ : both tubes survive with unequal conductivities. Redundancy is kept. -
$\mu = 1$ : only the short tube survives. -
$\mu > 1$ : the feedback is stronger than linear and the system commits early. Which tube wins depends on where it started: the bottom right panel starts with the long tube favoured and the long tube wins. The shortest path is not guaranteed.
Figure script: docs/figures/mold-mu-regimes.py.
A single source and sink give a tree or a path; a rail network has loops. Tero et al. 2010 apply the same adaptation rule to a network of many food nodes. As I recall the paper (unverified in detail), the sources and sinks are not fixed: the pair that carries the flux is changed from step to step, so that no single route is reinforced, and edges whose conductivity falls below a threshold are pruned. The small run below is my own illustration of that mechanism on a 9 x 6 jittered triangular mesh with six food nodes. It is not a reproduction of the Tokyo experiment.
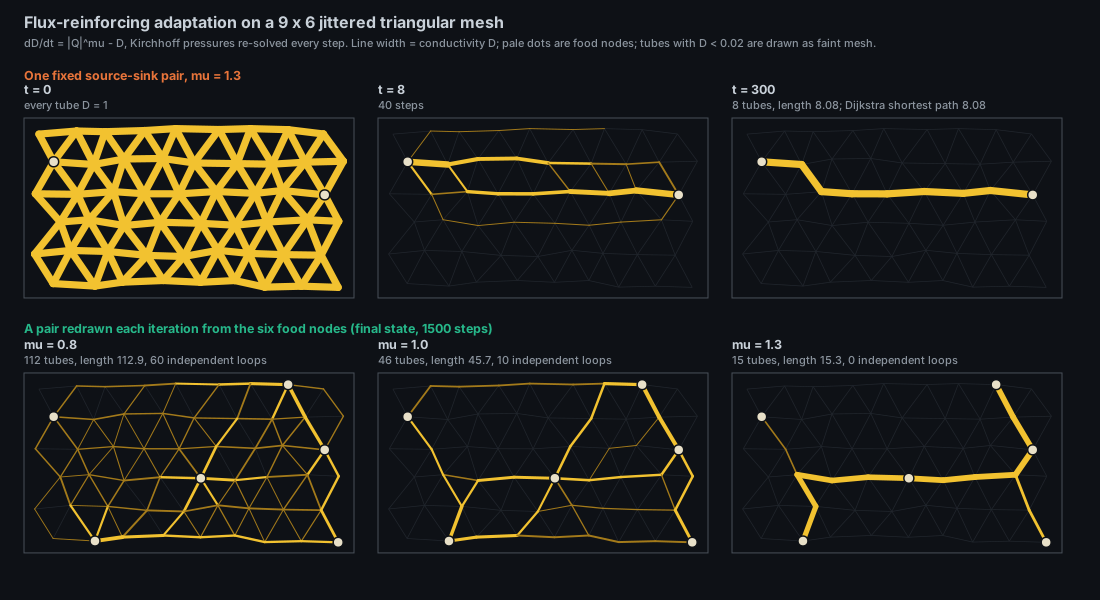
The top row uses one fixed source-sink pair with
| live tubes | total length | independent loops | |
|---|---|---|---|
| 0.8 | 112 | 112.9 | 60 |
| 1.0 | 46 | 45.7 | 10 |
| 1.3 | 15 | 15.3 | 0 |
Total length is the cost and the number of independent loops (edges minus nodes plus components) is the redundancy that gives fault tolerance. The exponent moves the network along the cost versus fault-tolerance trade-off that the 2010 paper measures on the Tokyo rail system. Figure script: docs/figures/mold-tero-adaptation.py (deterministic, seeded; the run takes about 8 s).
The continuum model needs a pressure solve and a graph. The organism does not have a graph; it has a body. Jones (2010) approximates the plasmodium by a large population of simple agents on a two-dimensional trail map, and shows that the same kinds of transport network emerge from purely local rules. The rules, at the parameters isotop's mold view is specified to use:
- Each agent has a position and a heading. It reads the trail at three sensors at distance
$SO$ ahead: forward, and at angles$\pm SA$ to the left and right (SA 22.5 degrees, SO 9 cells). - It turns by the rotation angle
$RA$ (45 degrees) toward the stronger reading. With$F$ ,$L$ ,$R$ the three readings: if$F > L$ and$F > R$ keep the heading; if$F < L$ and$F < R$ turn by$\pm RA$ at random; if$L < R$ turn right; if$R < L$ turn left. - It tries to move one cell (SS 1) along its heading. If the target cell is occupied (one agent per cell) the move fails and the agent picks a new random heading. If it moves it deposits 5 units on the trail.
- The trail map is then smoothed with a 3 x 3 mean and multiplied by
$(1 - 0.1)$ .
Food sources add attractant to the trail every step, so agents climb toward them. The trail concentration plays the role of the tube conductivity
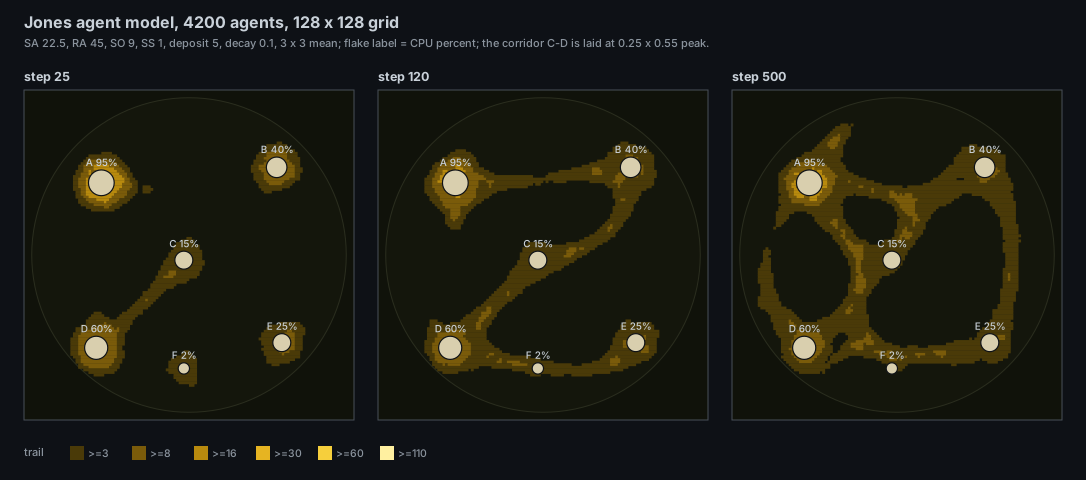
A pure-Python run of the rules above: 4,200 agents on a 128 x 128 grid, six flakes with CPU weights from 2 % to 95 %, one weak corridor between C and D. The corridor is joined first (step 25), then the flakes are wired into a web with loops (step 500). The grid is a third of the specified 384 x 384, so the sensing range of 9 cells is relatively three times longer: the picture shows the mechanism, not the view's scale. Script: docs/figures/mold-jones-agents.py.
Jones also reports that other settings of the angles and offsets give other networks. The brief notes that SA = RA = 45 degrees contracts the network into minimal paths and is worth trying as an alternative look; the issue lists a runtime switch to it as out of scope.
Every visual element maps to a measurement or is declared decorative. Source names are the fields of Snapshot and Process as they exist in the source tree.
| Visual element | Measured quantity (source) | Transform |
|---|---|---|
| Oat flake position | Stable ground position of the process: the orbit layout held still (layout in src/views/systems.rs with motion 0.0, which Flow already calls that way), hubs excluded |
none; the flake never moves when CPU or memory change |
| Oat flake area |
Process.memory (RSS; footprint on macOS) |
area |
| Attractant a flake emits | Process.cpu |
halo |
| Scent corridor along a link | loopback TCP rate (Snapshot::link_traffic), Unix queue bytes (Snapshot::unix_queues) and pipe rate (Snapshot::pipes), socket count (Snapshot::links) |
segment, Gaussian sigma 1.2 cells, amplitude |
| Total biomass (agent count) | machine CPU busy fraction | target |
| Where starving agents reappear |
Process.cpu of the flakes |
after 1,500 steps without food, at a flake rim chosen with weight |
| Vein brightness and thickness | the agents' own occupancy | density EMA 0.08 per step; slower tube EMA 0.006 per step; mold.py vein_colour ramp |
| Flake tint | Process.kind |
palette::kind_color, faint, near each flake |
| Status: biomass, vein length, connected a/b | the simulation's own state | agents; cells of the 0.8-blurred trail above 3.0; live flakes within 3 cells of the vein component touching most flakes; recomputed every 15 steps |
| Peristaltic brightness wave along veins | none | decorative: a 12 % brightness modulation |
| Agar texture, dish wall, rim, glass | none | decorative |
The two clamps in the flake-size row are worth knowing. The figure below plots the three specified transforms. The lower radius clamp of 2.5 cells never binds, because a process with zero memory already gets
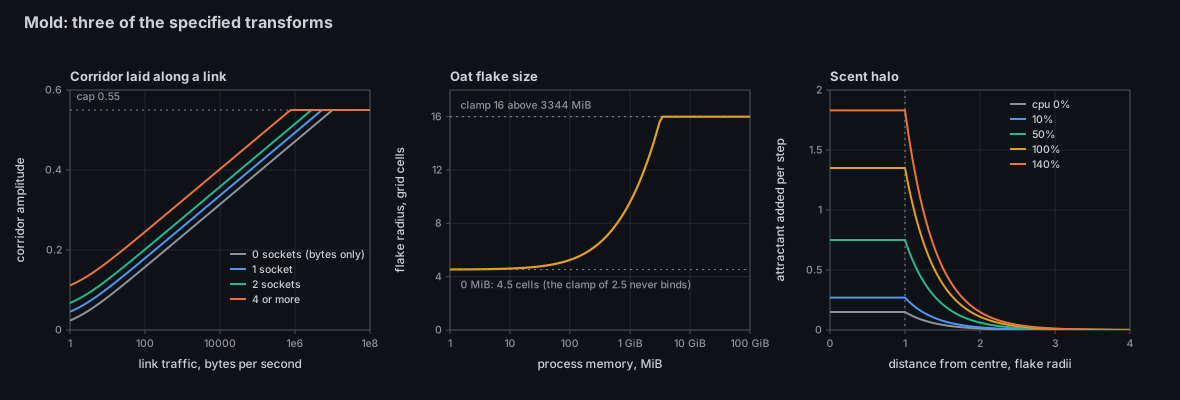
Script: docs/figures/mold-mapping-curves.py. The corridor saturates at
Everything in this section is the design of issue #41. The numbers are those of the issue; where the issue copies them from the prototype docs/mockups/code/mold.py it says so.
Module and registry. A new module src/mold.rs with #[derive(Default)] pub struct Mold implementing views::ViewModule (draw(&mut self, stage, processes, snapshot) -> usize), plus one row at the end of views::REGISTRY, built as ViewInfo::new("mold", "MOLD", Backdrop::Dusk, build) where build is a views::Build (a closure returning Box::new(Mold::default())). There is no plugin system: views are compile-time modules, and a view is one module plus one registry row. The scene builds the view from its row and owns its state, so the view keeps its own simulation in the struct. The layout above is a pub(super) function of views, so reaching it from src/mold.rs needs its visibility widened or a copy of the seating rule, which the issue does not settle. There are no view-local keys. Pure simulation state is kept free of drawing, in the style of medium.rs.
Dependencies. Status in the current source tree:
| Item | Provides | Status |
|---|---|---|
| P1 (#17), P2 (#18) | registry row, available(), v picker, Tab playlist |
merged |
| S1 (#22) | CPU/GPU parity check and tolerance | merged |
| S2 (#23) | simulation::FixedStep |
merged |
| S6 (#27) | source demand, status::missing_note and sources_note
|
merged |
| P3 (#19) | field primitive (src/render/field.rs: Field, Placement, Frame::field) with an owner grid for picking |
merged |
| B2 (#29) | Unix socket queues (Snapshot::unix_queues) and pipe links (Snapshot::pipes) beside the loopback TCP rates |
merged |
Every prerequisite is on main; the view itself is what is missing.
Simulation.
- Jones parameters: SA 22.5 degrees, RA 45 degrees, SO 9 cells, SS 1 cell, deposit 5, decay 0.1, a separable 3 x 3 mean for diffusion, and the occupancy rule applied sequentially in agent index order (which is what makes the run deterministic).
- Grid 384 x 384. The dish is a disc around the centroid of the flakes, radius the farthest flake plus 10 %. The grid is re-fitted only when the needed radius exceeds the reserved one by 15 % or falls below 60 % of it, mirroring the reservation rule of
layout::Discs. - Clock:
simulation::FixedStepat 30 Hz (step 1/30 s) on wall-clock time, at most 4 steps per frame. Paused or rewound time takes no steps. A test asserts the same trajectory at 10 and at 60 frames per second. - Randomness: one
simulation::Rngfrom a constant seed; respawns useRng::for_identity(flake identity, step). - Biomass: when below the target, agents bud from existing ones; above it, starving agents retire instead of respawning.
AGENTS_MAXis chosen with--benchmark(the issue suggests starting near 40,000). Simulation cost does not depend on the process count. - Fields: the food and corridor fields are rebuilt only when a sample arrives. The food halo, flake area and respawn rule are taken from
mold.py.
Rendering. The trail and vein colour are drawn by the field primitive (P3: one bilinear quad, not a triangle pair per cell), using the vein_colour ramp from the prototype. Flakes are kind-tinted ellipse fans of about 24 segments, pickable by process index. The dish wall and rim are triangles and decorative. The 12 % peristaltic wave is decorative and the README is specified to say so. The view fills stage.positions and pushes render::ring_bounds for the dish. On exit, the flake and its emission stop on that frame; the veins thin as the trail decays.
Picking. The P3 owner grid is the nearest live flake (a multi-source breadth-first search), rebuilt when the flake set changes. There are no non-process pickables: the inspector of each endpoint of a link gets a stage.notes line of the form vein on link A <-> B: <kind> <rate>, N fds, scent X of corridor max, with names passed through terminal::clean_text and render::label_name.
Degradation.
- Linux: full.
- macOS: available but degraded. CPU, memory, socket links and Unix pairs exist; link byte counters do not (
socket trafficappears inSnapshot.missing), so corridors use socket counts only and the status strip says so in the shared wording ofstatus::missing_note. The view is never replaced by a "not supported" screen.
Demo and headless. --demo must synthesize every field the view consumes; the issue asks to confirm that the demo fills the B2 fields (pipe links, Unix queue bytes) and to add what is missing. A headless --output or --benchmark run warms up by stepping the simulation without rendering through 45 s of demo samples ending at --time, so that the same --time gives a byte-identical PNG. The issue fixes the parity and README frame at --time 50.
Tests named by the issue include trail_decays_to_zero_with_no_agents_and_no_food, two_strong_flakes_are_joined_by_a_vein_within_600_steps, an_exited_flake_stops_emitting_attractant, starving_agents_reappear_at_flakes_in_proportion_to_cpu, biomass_tracks_machine_cpu_busy_fraction, a_corridor_follows_link_traffic_and_vanishes_when_the_link_closes, corridors_fall_back_to_socket_counts_without_link_traffic, mold_follows_the_same_trajectory_at_ten_and_sixty_frames_per_second and flakes_keep_their_places_when_cpu_memory_or_population_change.
Status line (specified): the legend names the mappings ( oat flake = process | area = memory | attractant = CPU | scent corridors = socket and pipe traffic | tint = kind | agents: Jones 2010, SA 22.5 RA 45 SO 9), preceded by dynamic counts biomass Nk agents | veins N cells | connected a/b as in the mockup.
What a viewer can and cannot infer once the view exists.
- Measured: which flakes are big (memory) and which are hot (CPU), where the links are and roughly how loud they are (corridor scent), and the machine's overall CPU busy fraction (the size of the mold).
- Emergent, not measured: the shape of the veins. The mold decides which of the available routes to thicken. A vein between two flakes means that the attractant of the two flakes and the corridor between them made a path worth reinforcing; it does not mean those processes exchange data. Conversely, two processes joined by a busy link may have no vein if a third flake offers a cheaper route.
- Thickness is occupancy, not bytes. Vein brightness is an exponential moving average of agent occupancy per cell, which is bounded by the one-agent-per-cell rule, so thick veins saturate. A vein ten times thicker does not carry ten times the traffic.
- The corridor is a hint, not a wire. It adds a weak scent along the segment between two endpoints on the screen layout; the mold may or may not use it. The hover text quotes the corridor's scent as a fraction of its maximum.
- The statistics are image statistics. "Vein length" counts cells of the blurred trail above a threshold, and "connected a/b" is a flood fill on the same image. They describe the picture, not the machine.
- Resolution. The grid is 384 x 384 over a dish that covers the whole layout; a flake of a few cells is the smallest thing the view can show, and the interior structure of a tight cluster of processes cannot be resolved.
- Time scale. Agents move one cell per step at 30 steps per second; a vein takes seconds to form and to retract, so a process that lives for less than a second does not leave a vein.
None of these commands works yet: mold is not registered.
# Once the view lands (issue #41); the parity frame is at --time 50.
./target/release/isotop --demo --view mold --time 50 --width 1600 --output /tmp/mold.png
./target/release/isotop --demo --view mold --renderer cpu --width 1920 --benchmark 120
./target/release/isotop --list-views          # mold will appear after the existing views
Today, the figures on this page regenerate from the repository root:
python3 docs/figures/mold-tero-adaptation.py
python3 docs/figures/mold-mu-regimes.py
python3 docs/figures/mold-jones-agents.py
python3 docs/figures/mold-mapping-curves.pyNothing is implemented. What exists today and what the design will use:
-
src/views.rs:REGISTRY,ViewInfo,Build,ViewModule, the row wheremoldwill be added. -
src/render/field.rs: the field primitive the trail is drawn with (Field,Placement,Frame::field). -
src/views/systems.rs:layout, the orbit layout the flakes sit on. -
src/simulation.rs:FixedStep,Rng::for_identity. -
src/layout.rs:Discs(stable disc reservation),Seats,vacant. -
src/render.rs:Stage,Backdrop,ring_bounds,label_name;src/terminal.rs:clean_text. -
src/model.rs:Snapshot::link_traffic(loopback TCP bytes/s per pair),Snapshot::links,Snapshot::unix_links,Snapshot::unix_queues,Snapshot::pipes,Snapshot::missing. -
src/medium.rs: the model of a pure simulation state (the wave equation and flow particles). - Prototype, reference only:
docs/mockups/code/mold.py(Mold.step,build_fields,topdown). - Issue: #41; roadmap:
docs/ROADMAP.md.
-
SA = RA = 45 degrees. The brief says this contracts the network into minimal paths. A runtime switch is out of scope for the first PR, but a
--mold-angleflag would make a good first experiment. - A real pressure solve on the mold's graph. Build the graph of flakes and corridors, run Tero's model on it (a Laplacian solve of a few dozen nodes is trivial), and draw its conductivities as a second layer or a comparison mode. Does the agent model's vein topology agree with the continuum model's at matched parameters?
- Loops as redundancy. The loop count of the trail (cycles of the vein skeleton) could be reported next to "connected a/b", as a fault-tolerance figure in Tero's sense.
-
Measure the correspondence. Estimate the effective exponent
$\mu$ of the agent model by measuring the trail increase as a function of agent flux in a corridor. The sigmoid argument above is a conjecture. -
Which traffic scale? The corridor saturates at about
$10^7$ bytes/s, below the rates of a busy loopback socket. A per-link normalisation would show relative traffic instead of absolute. - The observer flake. isotop is a process, so it is a flake, and its CPU is what pays for the mold. The mold is therefore partly fed by the cost of its own growth. The specification does not exclude it.
- Memory pressure as nutrient. Nothing in the specification uses pressure; the mold could shrink its biomass target under memory pressure, the way a starved plasmodium retreats.
- T. Nakagaki, H. Yamada, Á. Tóth, "Maze-solving by an amoeboid organism", Nature 407, 470 (2000).
- A. Tero, R. Kobayashi, T. Nakagaki, "A mathematical model for adaptive transport network in path finding by true slime mold", Journal of Theoretical Biology 244, 553-564 (2007).
- A. Tero, S. Takagi, T. Saigusa, K. Ito, D. P. Bebber, M. D. Fricker, K. Yumiki, R. Kobayashi, T. Nakagaki, "Rules for biologically inspired adaptive network design", Science 327, 439-442 (2010).
- J. Jones, "Characteristics of pattern formation and evolution in approximations of Physarum transport networks", Artificial Life 16(2), 127-153 (2010).
- V. Bonifaci, K. Mehlhorn, G. Varma, "Physarum can compute shortest paths", Journal of Theoretical Biology 309, 121-133 (2012).
- A. Adamatzky, Physarum Machines: Computers from Slime Mould, World Scientific (2010).