Repository navigation
View Cores
Cores draws the machine's CPUs as a banked circular track: one lane per logical CPU, performance cores inside in gold and efficiency cores outside in teal, each lane lit by how busy its CPU was, with chevrons turning at its clock and a short queue of red beads behind the start line for the tasks waiting to run on it. Running processes are marbles that go once round per ten seconds of CPU time and hop across lanes when the scheduler moves them. It is the only view in which the hardware, not the process tree, supplies the geometry.
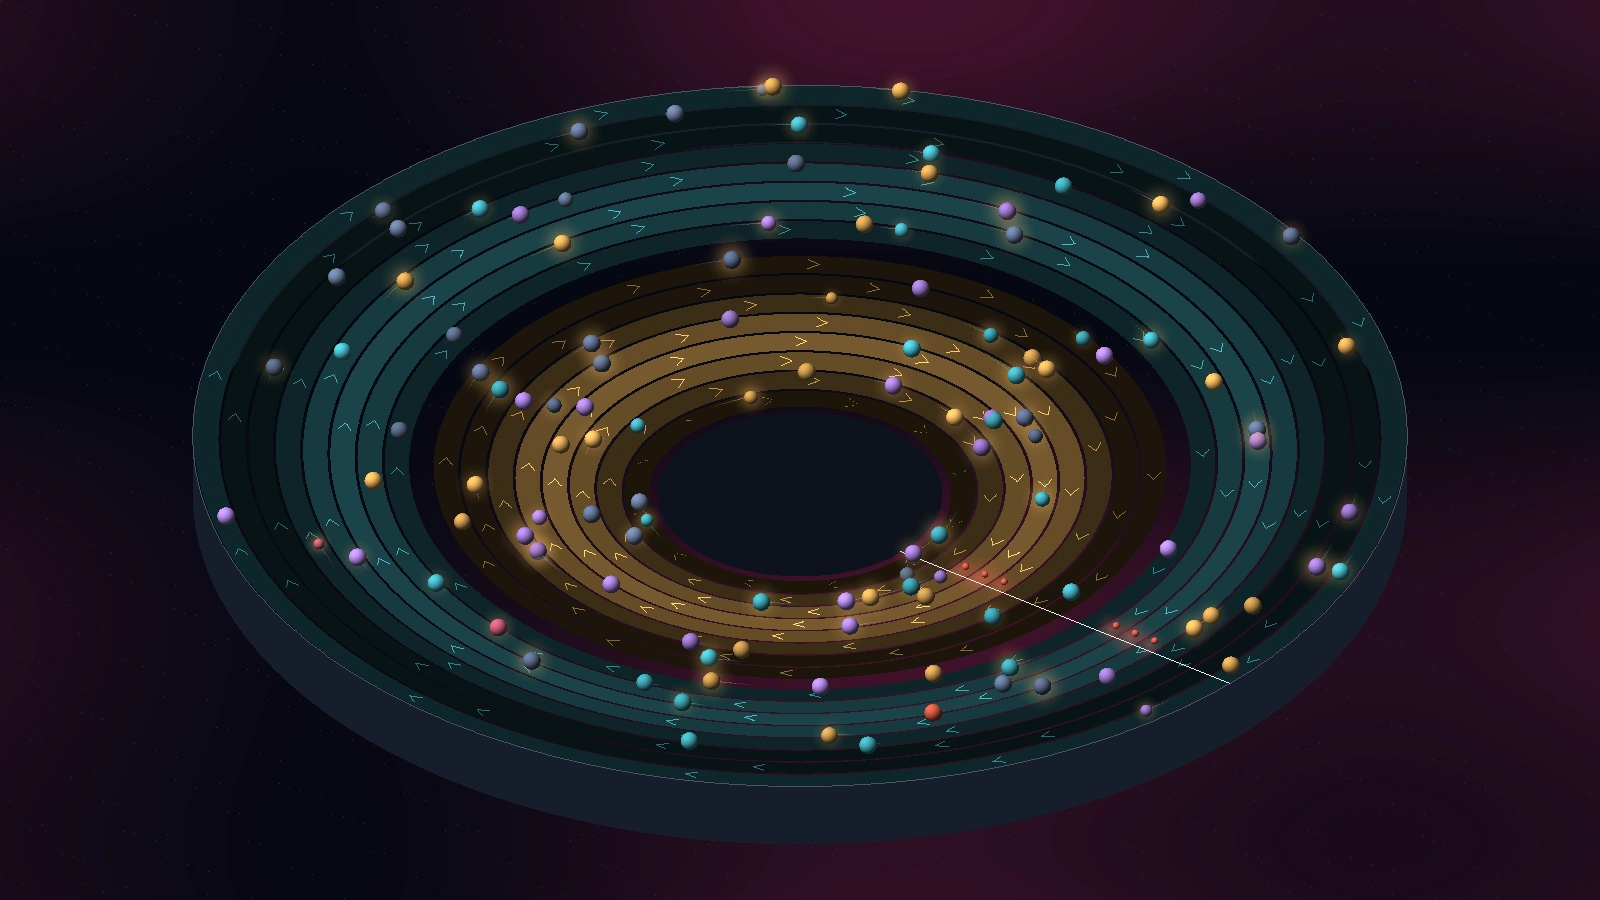
A modern CPU package is not one speed. Three physical facts decide what a Cores lane can honestly show.
Frequency scaling. A CMOS core burns dynamic power roughly as cpufreq subsystem: a driver and a governor
choose a frequency per core, and /sys/devices/system/cpu/cpuN/cpufreq/scaling_cur_freq reports, in kHz, the
frequency the kernel believes the core runs at. What that number means precisely depends on the driver (it is the
last frequency the kernel requested on some drivers and a hardware-feedback estimate on others); it is the kernel's
account of the clock, not an independent measurement.
Heterogeneous cores. Since ARM's big.LITTLE (2011) and, in desktop silicon, Apple's M1 (2020) and Intel's 12th-generation hybrid parts (2021), one package holds performance cores (wide, fast, power-hungry) and efficiency cores (narrow, slow, frugal). The scheduler's job becomes placement: a task that can wait belongs on an efficiency core, a latency-critical one on a performance core. A task's migration between the two kinds is therefore an event that means something.
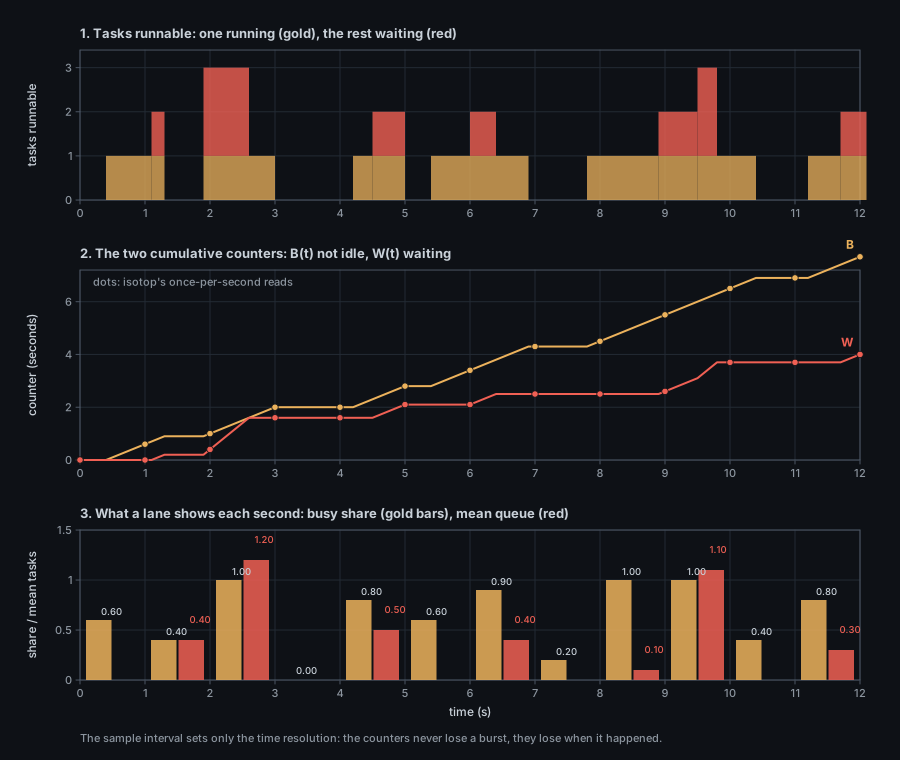
Utilisation and queueing. A CPU is either executing something or idle; the kernel integrates the busy time into a monotone counter. The run queue is the set of tasks that are runnable but not running because the CPU is taken. Time spent waiting in it is the cost of contention, and the kernel accumulates that too, per CPU.
Let
the fraction of the interval the CPU was not idle, however the busy time was distributed inside it. The same
holds for the waiting counter
The thing Cores draws is the multi-core, and later heterogeneous, processor, and the kernel's bookkeeping of what each core did.
- For decades a faster processor meant a faster clock. Dennard scaling, from a 1974 paper co-authored by Robert Dennard, said that shrinking transistors kept power density roughly constant, so clocks could rise at constant power per area. Its breakdown is usually dated to the mid-2000s, when leakage current made chips overheat; sources put it variously between about 2005 and 2007, and the effects were visible earlier.
- IBM's POWER4 (2001) put two cores on one die and is generally described as the first non-embedded microprocessor to do so; the claim depends on how "first" is defined. Intel cancelled Tejas and Jayhawk, the planned successors to the Pentium 4 core, on 7 May 2004 and moved to dual-core designs; contemporary reports cite power and heat.
- The energy argument for frequency scaling predates the multi-core turn. Weiser, Welch, Demers and Shenker (Xerox PARC, OSDI 1994) proposed that a scheduler adjust the clock to the workload, and evaluated policies against traces from workstations. The policies, as a secondary summary names them (
(unverified)against the paper itself), are OPT, which needs the whole future, FUTURE, which needs a short window of it, and PAST, which looks only at what has already happened. Cores, which can only read counters, belongs to the third class. - Heterogeneous cores arrived in phones first. ARM's big.LITTLE pairs a fast core design with a frugal one; the page above dates the announcement to 2011, and Samsung showed the Exynos 5 Octa, four Cortex-A15 and four Cortex-A7, at CES in January 2013. Apple's M1 (2020) and Intel's twelfth-generation hybrid parts (2021) brought the idea to the desktop, and the scheduler's job became deciding which kind of core a task deserves.
- The kernel side is older than all of it. Cumulative per-CPU tick counters in
/proc/statare what makes a lane's busy share an exact difference quotient, and J. D. C. Little's proof of$L = \lambda W$ (1961) is what lets the run-queue counter be read as a mean queue length without assumptions about arrivals.
-
/proc/statper-CPU lines give cumulative ticks (USER_HZ, normally 100 per second) in the order user, nice, system, idle, iowait, irq, softirq, steal, guest, guest_nice. isotop sums the first eight astotaland countsidle + iowaitas idle, sobusy = total - idle - iowait. Guest time is already inside user and nice, which is why it is not added. Steal (time a virtual CPU wanted to run but the hypervisor ran something else) is counted busy: in a virtual machine a lane can glow because the host is contended, not because work was done. -
/proc/schedstathas onecpuNline per CPU. In the per-CPU line the eighth number is the cumulative time, in nanoseconds, that tasks spent waiting on that CPU's run queue (run_delay); isotop reads it as index 7 of the values (WAIT_FIELD). The ratio$\Delta W / \Delta t$ is the mean queue length. - Resolution. With
USER_HZ = 100and one-second samples, a lane's busy share moves in steps of 1 %. Faster sampling does not help below the 10 ms tick: the floor is$1/(100,\Delta t)$ .
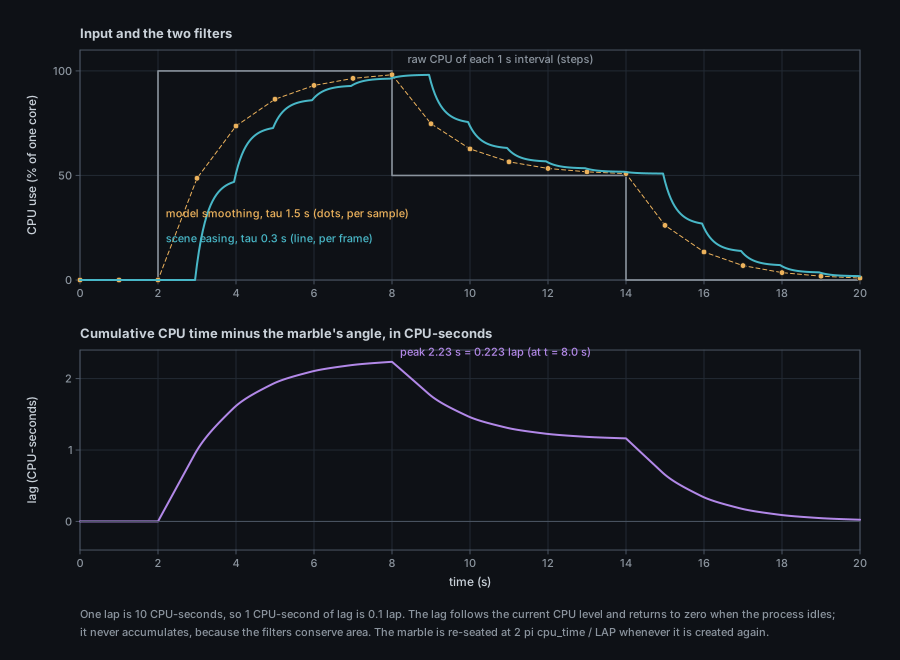
A marble's angle is
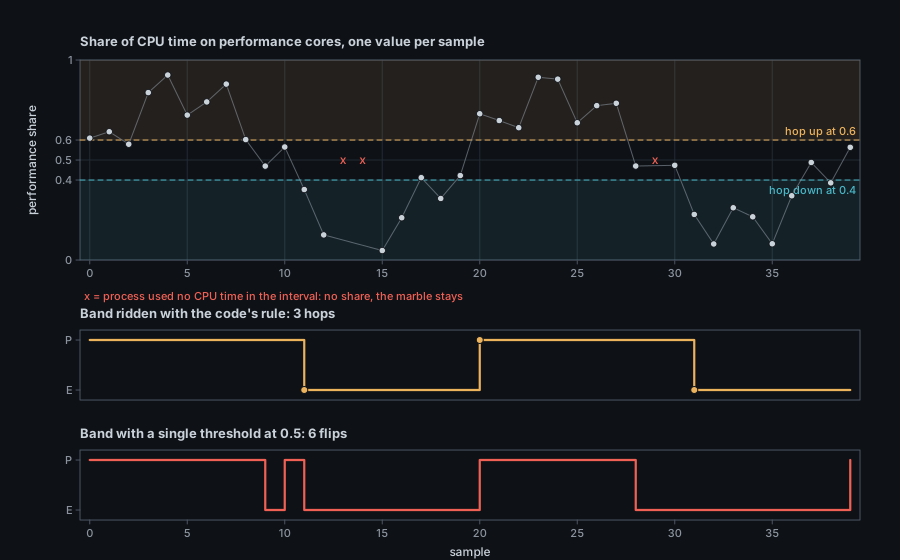
macOS reports no last CPU. It reports, per process, how its CPU time in the last interval divided between
performance and efficiency cores. Cores turns that share
Realness contract: every element is a measurement, a derivation from one, or declared decorative.
| Visual element | Measured quantity (platform source) | Transform |
|---|---|---|
| Lane | One logical CPU: /proc/stat lines (Linux); the core count with kinds from the IORegistry cluster-type (macOS) |
Lanes sorted by (kind, id): performance, then efficiency, then unknown; a gap of GROUP_GAP where the kind changes |
| Lane colour | Core kind: /sys/devices/cpu_core/cpus and cpu_atom/cpus (Linux, hybrid Intel only), cluster-type (macOS) |
Gold performance, teal efficiency, grey-blue unknown |
| Lane brightness | Busy share of the last interval, Cpu::busy
|
surface tint |
| Chevron speed |
scaling_cur_freq / 1000 as MHz (Linux); cycles per CPU-second of the cluster (macOS) |
Phase advances |
| Red beads at the start line |
/proc/schedstat run delay, Cpu::wait (Linux) |
round(wait) beads and a glow once it exceeds 0.05 |
| Marble | A process with cpu >= 1 or state R
|
One per such process |
| Marble lane |
Process::core: field 39 of /proc/<pid>/stat (Linux) |
The lane of that CPU; an unknown CPU goes to the first lane |
| Marble band (macOS) |
performance_share from proc_pid_rusage V6 |
Hysteresis 0.4 and 0.6; band is the mean radius of the lanes of its kind |
| Marble speed |
Process::cpu, smoothed (1.5 s) then eased (0.3 s) |
|
| Marble size | Process::memory |
mass_radius is |
| Marble colour | Kind and state |
kind_color: slate kernel, teal system, amber session, violet container; zombie, stopped and blocked override |
| Marble trail | Process::cpu |
|
| Marble glow |
Process::cpu above 20 % |
Radius and strength grow with |
| Hop | Change of Process::core between samples, or of band (macOS) |
0.6 s smoothstep across the lanes along an arc whose height is |
| Red beads behind a marble (macOS) | Runnable time minus CPU time per process, Process::waiting
|
One bead per waiting thread on average, up to 6 |
| Lane label | Counts by Process::core
|
cpuN{P,E} X.XGHz Y% | a running, b idle; counts omitted when there is no last CPU |
| Banking, infield, wall, start line | none | Decorative |
| Lane radius | none | Decorative: the same angular speed is a larger linear speed on an outer lane |
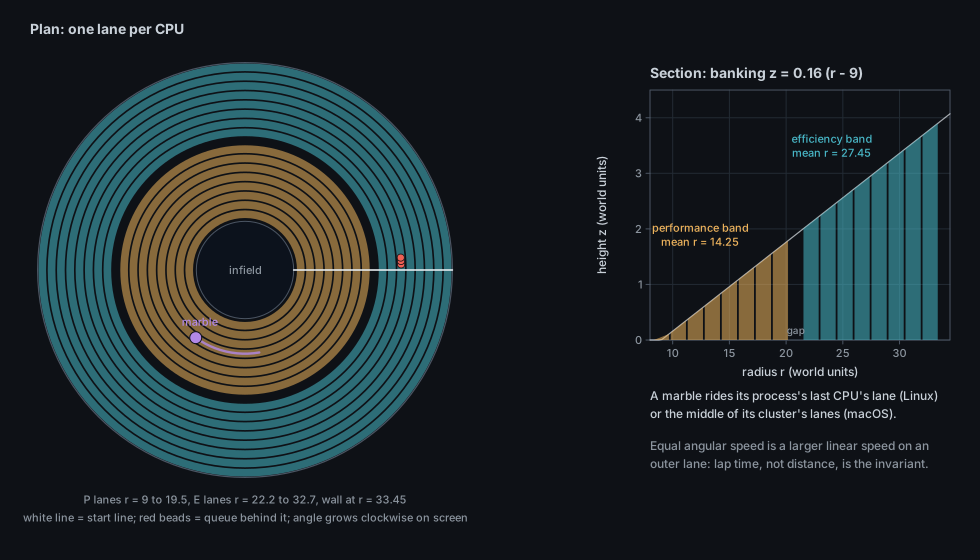
Geometry. Cores is a ViewModule in src/cores.rs: the state struct Track owns the marbles and the chevron phases, and its registry row in views::REGISTRY builds it with a closure, so Scene holds none of it. Track::draw sorts the CPUs by (kind, id); CoreKind derives Ord with
Performance < Efficiency < Unknown, so performance lanes sit inside. The first lane is at radius INNER = 9, each
lane is LANE = 1.5 wide, and GROUP_GAP = 1.2 opens where the kind changes. The demo's 16 CPUs (8 performance, 8
efficiency) put performance lanes at radius 9 to 19.5 and efficiency lanes at 22.2 to 32.7 with the wall at 33.45.
The track is banked like a velodrome: a point at radius BANK). With the default camera, whose scene axes read left-handed on screen, the angle grows clockwise; the
chevrons and marbles run that way.
Lane drawing. Each lane is 120 quads (SEGMENTS). The start line is a single line at angle 0 from the infield to
the wall. Queue beads sit at angle
Marbles. A marble exists while its process is active (cpu >= 1.0 or state R) and, on Linux, a last CPU is
available; it is created at angle Track keeps a Marble per Identity (angle, last core, hop, hop count,
band). A marble that is sampled and still busy but hidden by focus or --limit waits where it was and races on
when drawn again; one whose process idles or exits is dropped, so it is re-seated from cpu_time when it returns.
Time step. Track clamps its own frame step to stage.time; it does not use stage.dt.
Chevron phase and marble angle both use it. Phase is per CPU and starts at id * 1.9 rad so lanes do not line up.
Hops. On Linux a hop starts when process.core changes: the marble leaves its old lane radius and eases to the
new one over HOP_SECONDS = 0.6 s with a smoothstep, rising along FIRST_LEVEL).
Stable layout. Lanes are placed from the CPU list alone, so they never move. Marbles move by design, since the angle is an integral
of CPU use, so the view harness does not check where a marble is drawn. Track returns from ViewModule::anchors
(test-only) the start line of the lane each marble rides, or of the band it rides by cluster, and the harness checks
that instead. The row waives no property.
The camera fit uses a fixed ring envelope (ring_bounds of radius outer + 1, height up to the rim plus 2).
Sources and degradation. The legend (Track::legend) names what the snapshot lacks:
| Missing | Effect |
|---|---|
Source::CoreKinds (any CPU that is not hybrid Intel, ARM big.LITTLE included, on Linux) |
One colour; the legend says "no core kinds reported" |
Source::CpuClock (cpufreq absent, common in virtual machines; or no cycle counters on macOS in a VM) |
Chevrons stand still; "no clock readings" |
Source::RunQueue (/proc/schedstat unreadable or too old to count waiting) |
No red queue; "no run queue readings" |
Source::LastCpu |
No Linux marbles. On macOS with a performance share and both kinds present, marbles ride the bands instead |
Where a platform reports the clock per cluster (per_cluster holds CpuClock), every lane of a kind shows the same
clock and the legend says "cluster clock (cycles per CPU second)". On macOS that clock is cycles divided by the CPU
time they ran in, summed over every readable process, and a cluster with under 0.05 s of CPU time in the interval
has no reading.
CPU and GPU. Cores draws only quads, lines, beams, glows and sphere impostors, all shared primitives, so the two
rasterizers draw it alike. It declares no link_strokes, no pitch and no special camera. Its registry row uses the
Space backdrop and a four-second headless settle (SETTLE: 80 frames 0.05 s apart, starting 4 s before the time).
- Brightness and chevrons are the hardware; marbles are the software. Lane brightness is exact to one tick per sample. Chevron speed is the kernel's frequency report (Linux) or a derived average (macOS), not a per-core measurement on macOS.
-
A marble's lane is one thread's last CPU.
/proc/<pid>/statdescribes the thread-group leader. A multi-threaded process runs on many CPUs at once, and isotop draws one marble on the leader's CPU. A "hop" is two consecutive samples that disagree, so a task migrating a thousand times a second shows as at most one hop per sample, and a task that returns to its CPU between samples shows none. - Phase is cumulative CPU, not position. A marble's place on the lane carries no spatial meaning; only its angular speed, hence its lap count, relates to CPU use, and it lags the truth by up to about 0.2 lap. Two marbles side by side are not contending for anything.
- Idle processes are absent. Processes under 1 % CPU and not running count only in the lane label; the label's counts use the processes' last CPU even when it is stale.
- Red beads are an average. A lane showing two beads had a mean queue length near two over the last interval, not two tasks lined up at one instant; sleeping tasks and the CPU's own idle tick do not count.
- Steal looks like load. On a virtual machine a bright lane may be the host's contention.
- Unknown core kinds are not guessed. ARM big.LITTLE on Linux shows as one colour because the sysfs interface isotop reads names only Intel hybrid CPUs.
./target/release/isotop --demo --view cores --width 1600 --output cores.png --renderer cpu
./target/release/isotop --demo --view cores --time 40 --output cores40.png   # fixed workload time
./target/release/isotop --view cores                                          # live; or press 5 in a session
The demo has 16 CPUs (eight performance, eight efficiency) with synthetic loads and clocks (performance
on cpuN (performance core) | k hops between cores while watched on Linux, or ran X% of its CPU time on performance cores | k cluster hops while watched | w threads waiting on average on macOS. Headless PNGs carry no text labels; they are terminal overlays.
-
src/cores.rs:Track,Track::draw,Track::legend,Track::anchors,Marble,hopping,hop_trail,by_cluster,active; constantsLAP,INNER,LANE,GROUP_GAP,BANK,HOP_SECONDS,TO_PERFORMANCE,TO_EFFICIENCY,FIRST_LEVEL. -
src/platform/linux/mod.rs:cpus,Ticks,WAIT_FIELD,cpu_gaps,core_kinds,fixed_gaps. -
src/platform/macos/logic.rs:core_kind,cluster_clocks,Counters. -
src/model.rs:Cpu,CoreKind,measure(cpusmoothing,performance_share,waiting). -
src/palette.rs:core_color,core_name. -
src/views.rs: thecoresregistry row (SETTLE). - Figures:
docs/figures/cores-*.py.
-
Per-thread marbles.
/proc/<pid>/task/<tid>/statcarries a last CPU per thread; one marble per running thread would show a multi-threaded process fanning across lanes. This costs one read per thread per sample. -
Effective frequency. On x86 the ratio of the APERF to MPERF counters, read through
/dev/cpu/N/msr(root), gives the delivered frequency; compare it withscaling_cur_freqand let the chevrons disagree where the two do. -
A true big.LITTLE detector. Read
cpu_capacityfrom sysfs to colour ARM cores by capacity. -
Wake-up latency instead of queue length. The same
/proc/schedstatline carries the count of timeslices run; the mean wait per slice,$\Delta W / \Delta\text{pcount}$ , is a latency, a different quantity from the mean queue length. - Open: is a lap per 10 CPU-seconds the right quantum? Slower laps would make the phase lag negligible and hide short bursts; faster ones would alias against the frame rate.
- M. Weiser, B. Welch, A. Demers, S. Shenker, "Scheduling for Reduced CPU Energy", Proceedings of the 1st USENIX Symposium on Operating Systems Design and Implementation (OSDI), 1994.
- J. D. C. Little, "A Proof for the Queuing Formula: L = λW", Operations Research 9(3), 1961, pp. 383-387.
- Linux kernel documentation:
Documentation/scheduler/sched-stats.rst(the/proc/schedstatfields) andDocumentation/admin-guide/pm/cpufreq.rst(the cpufreq interface);proc(5)for/proc/statand/proc/<pid>/stat;time(7)forUSER_HZ. - Related pages: Theory: Sampling on Linux, Theory: Sampling on macOS, Theory: Model and rates, Theory: Stable layout, View: Coop (whose feeders are the same cores).