Repository navigation
View Globe
Globe shows where the machine's TCP connections go. A sphere with Natural Earth coastlines turns once every five
minutes; from home, a great-circle arc rises to every remote place a connection lands, brighter with more traffic,
cyan when the place is mostly sending to this machine and pink when mostly receiving from it, with pulses travelling
the way the bytes flow. The processes that hold the connections hover in a golden-angle cloud above home, and their
inspector lists each connection with its round-trip time and byte rates, which come from the kernel's own
tcp_info. Addresses with no known place circle the north pole, with a label that says why. Every lookup is local;
nothing is sent anywhere.
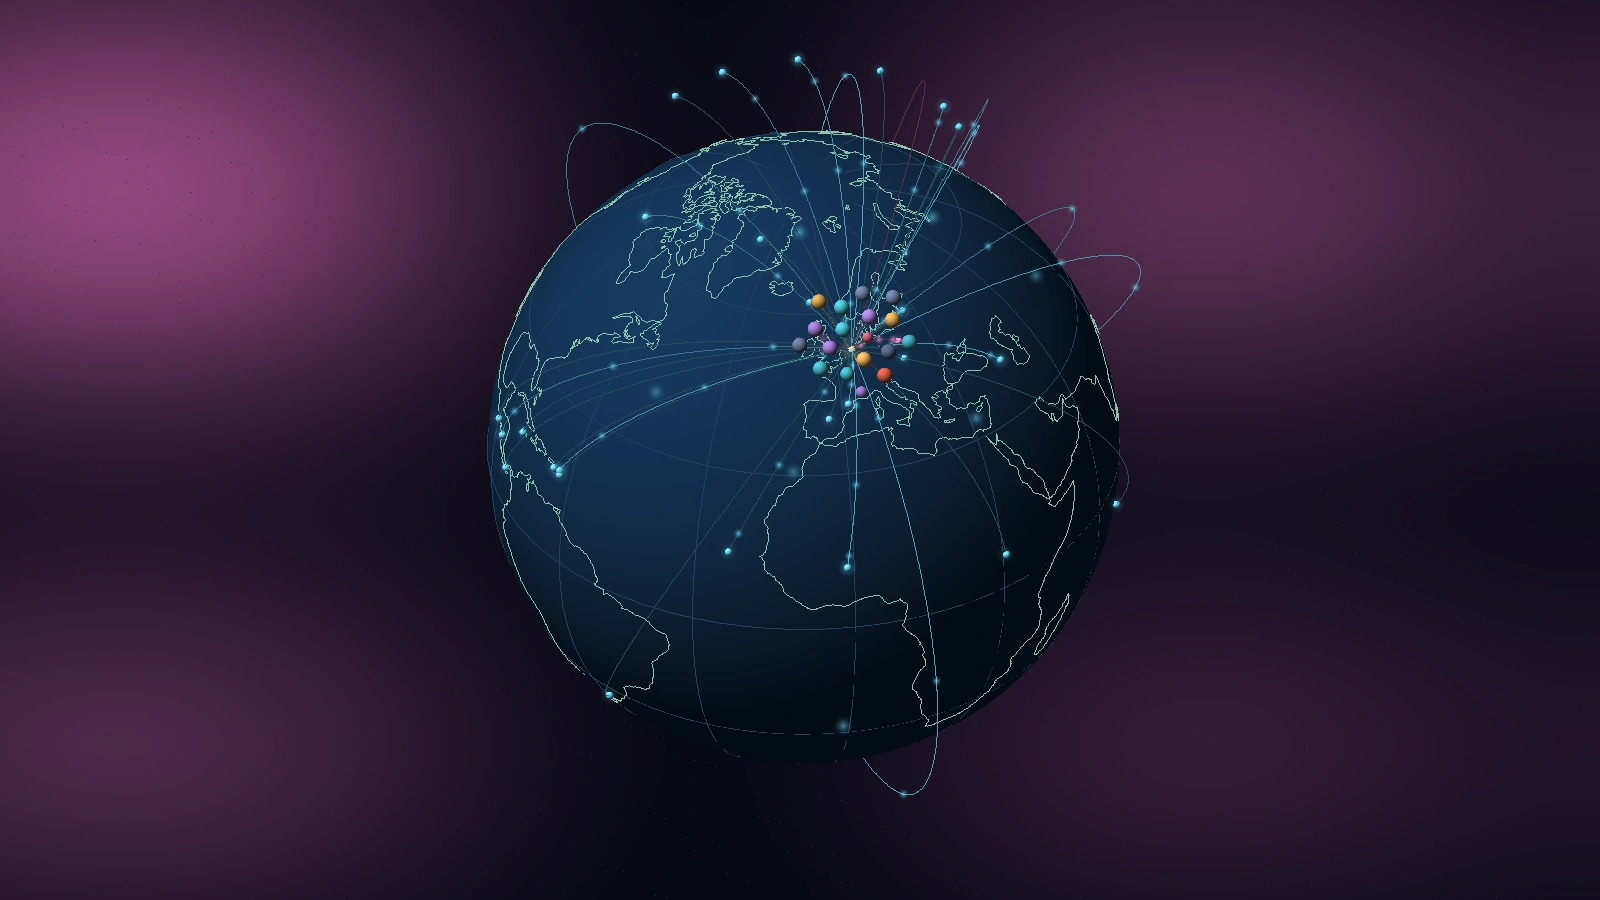
Three separate pieces of physics and geodesy meet in this view, and each is exact in the theory and approximate in the picture.
The sphere, seen without perspective. Drawing a globe on a flat screen is a map projection. The camera of
isotop is orthographic: projectors are parallel, so a sphere of radius
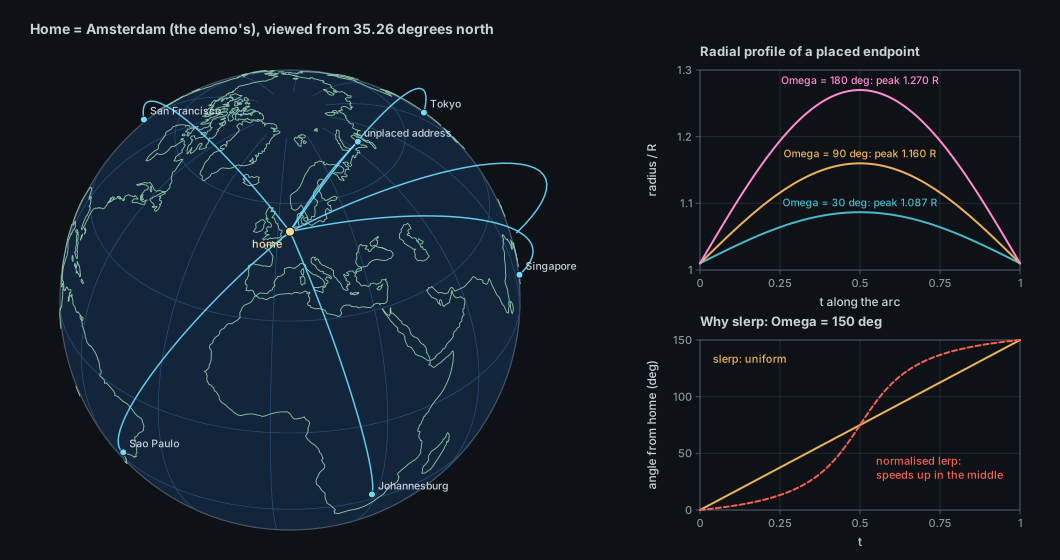
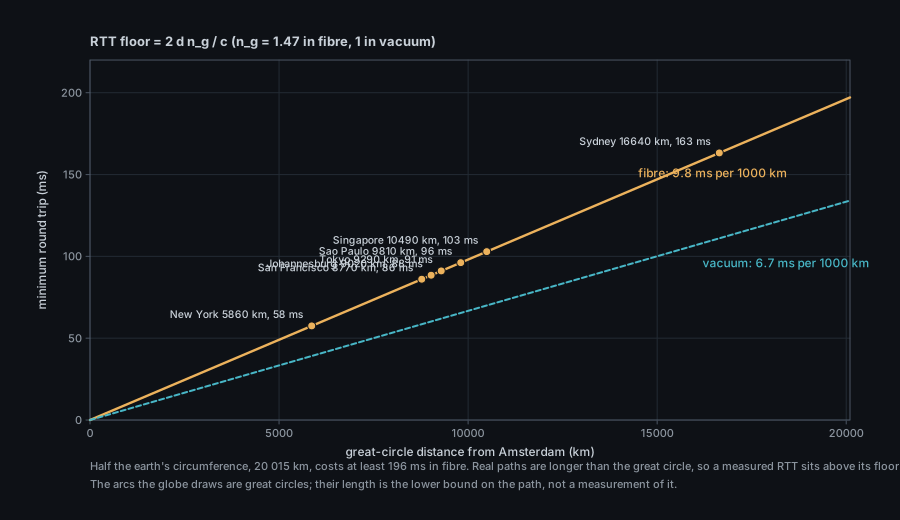
Great circles. The shortest path between two points on a sphere lies on the great circle through them, the intersection of the sphere with the plane through the two points and the centre. The arcs of the globe are great-circle segments. Network traffic does not follow them: it follows cables and routers. The arc is the geodesic lower bound on the path, not the path.
Where an address is. An IP address has no coordinates. A geolocation database maps address blocks to places by combining registry records, routing data and measurements, so a location is a statistical claim about a block: at best the city of the block's users, at worst the country's centroid, and wrong for anycast, content networks, mobile carriers and VPNs. isotop reports such a place as what the database says and never as a measurement.
The projection. The view of a sphere from infinitely far away, the orthographic projection, is among the oldest in the record. Hipparchus is credited with using it in the second century BCE to work out where stars rise and set, and for a long time it went by the name analemma. Its present name is generally credited to the Antwerp Jesuit Francois d'Aguilon, in his Opticorum libri sex (1613), the book Rubens illustrated; sources differ over whether he coined the word or took it from Vitruvius, and one older source applies the same coinage to the stereographic projection, so the attribution is not settled here. Mercator's cylindrical projection (1569) came 1,700 years later and answered a different question, how to draw a constant bearing as a straight line.
The meridian. A globe needs a zero of longitude, and for most of history there was none. The International Meridian Conference in Washington in 1884 chose Greenwich: 22 delegations voted for, San Domingo against, and France and Brazil abstained. It matters here because geo::home can fall back to longitude 0.
Coastlines. Computer cartography began with the geographic information systems of the 1960s, of which Roger Tomlinson's Canada Geographic Information System is the usual first example (the dates of its stages are unverified here). The coastlines in src/coastline.bin come from Natural Earth, a public-domain dataset published at scales of 1:10, 1:50 and 1:110 million by Tom Patterson and Nathaniel Vaughn Kelso, later maintained as a volunteer project supported by the North American Cartographic Information Society. isotop uses the coarsest scale. The launch year is not confirmed here.
Addresses to places. An IP address has no position. MaxMind, founded in 2002, says it coined the term GeoIP that year and launched a commercial address-to-location database; it later released a free subset, GeoLite. The legacy GeoLite files (GeoIP.dat) were retired on 2 January 2019 in favour of GeoLite2, in the MaxMind DB format; DB-IP publishes a compatible free city database. isotop reads both formats: see "Databases" below.
Let the view be centred on latitude
-\sin\varphi_0\sin\lambda_0,\ \cos\varphi_0)$. The screen coordinates and the depth of the point are the three
dot products:
The point is on the visible hemisphere iff
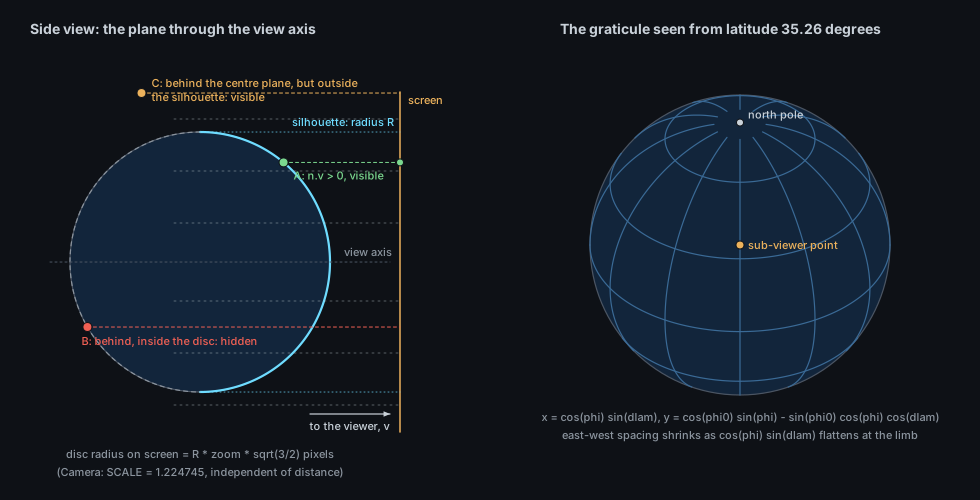
isotop's camera is this projection. Camera::view maps a ground point across = x cos(κ+π/4) - y sin(κ+π/4), along = x sin(κ+π/4) + y cos(κ+π/4),
screen right
The earth turns once in SPIN_SECONDS = 300 s, eastward: globe_tilt). A horizontal scroll turns it by hand (globe_turn) and holds it still until r or the tour lets it spin again.
Let
which is spherical linear interpolation (slerp; Shoemake, 1985) and sweeps the angle at a constant rate. The
cheaper "interpolate linearly and normalise" does not: the chord's midpoint is nearer the centre, so the normalised
point moves fastest in the middle (the dashed curve in the figure below, at acos(clamp(dot)); for the central angle between points slerp returns the start. At exactly antipodal points
For each established TCP socket the kernel keeps a struct tcp_info, which isotop asks for over sock_diag
(INET_DIAG_INFO). It reads three fields, at byte offsets in the structure:
| Field | Offset | Meaning |
|---|---|---|
tcpi_rtt |
68 | Smoothed round-trip time, in microseconds: the |
tcpi_bytes_acked |
120 | Bytes of payload the peer has acknowledged, cumulative (RFC 4898's HCThruOctetsAcked) |
tcpi_bytes_received |
128 | Bytes of payload received, cumulative |
The structure also carries the congestion window, the RTT variance, retransmission and loss counts, the pacing rate
and much else; isotop does not read them. RTT goes to the inspector only: the arc's geometry, colour and speed use the byte counters. The rates are
model::remotes, minimum divisor 0.1 s); "up" is the
acknowledged byte count, so it lags the application's send by about one round trip.
What the RTT bounds. Light in glass travels at
A MaxMind DB file (the format of GeoLite2 and DB-IP) is a binary search tree over the bits of the address,
walked from the most significant bit, whose leaves point into a data section of records (latitude, longitude, city and
country names); isotop reads it with the maxminddb crate and names a place City, CC. The legacy country database
(GeoIP.dat, GeoIPv6.dat) is simpler: a tree of 6-byte nodes, two 3-byte little-endian records each, indexed by the
next address bit; a record at or above COUNTRY_BEGIN = 16 776 960 is a leaf whose country index is the value minus
that constant (legacy_country in src/geo.rs). It names only a country, which isotop places at the Natural Earth
label point of that country.
| Visual element | Measured quantity (platform source) | Transform |
|---|---|---|
| Sphere, coastlines, graticule | none (Natural Earth 110 m coastlines in src/coastline.bin) |
Radius 20; coast at |
| Rotation | wall-clock of the animation |
|
| Home marker |
--home LAT,LON, else the system time zone's city |
At |
| Endpoint | Remote addresses of established TCP connections (/proc/net/tcp*, sock_diag), located by the local GeoIP database |
One per rounded (latitude, longitude) degree cell; an unplaced address is its own endpoint |
| Arc | The same | Great circle from home, 40 segments, lifted by |
| Arc brightness | Up plus down byte rate of the endpoint (tcp_info, summed over its connections) |
tint |
| Arc colour | Which of down and up is larger | Cyan |
| Pulses | Same rates | Three per arc when traffic exceeds 64 B/s; speed |
| Endpoint glow and bead | Traffic | Glow strength |
| Label (12 busiest) | Place name, or the address if unlisted or private | Drawn only when facing the viewer; xN for N connections |
| Ring around the pole | Addresses with no place: no database, still being located, unlisted, private | Direction |
| Process sphere above home | A process with at least one remote connection | Golden-angle spiral (spacing 0.9) at |
| Inspector lines |
Remote: address, port, place, RTT, up, down |
addr:port place | N ms | up X/s down Y/s, four connections then "and n more connections" |
| Arc lift, glow, graticule, stems | none | Decorative |
Data. platform::linux::net::sample finds socket owners from /proc/<pid>/fd and lists established TCP connections
from /proc/net/tcp and tcp6; a connection whose other end is also on this machine is a loopback link; the others,
with an owner, are remote. For these tcp_sockets runs two sock_diag dumps (IPv4, IPv6) asking for established sockets
with INET_DIAG_INFO and reads RTT and the two byte counters; a socket without readable statistics is left out rather
than shown with zero counters. Only processes whose descriptor tables isotop may read are seen. UDP is not scanned:
QUIC and other UDP traffic never appears. The scan runs every 2 s on the background thread; byte rates are
differences between scans, None on a socket's first appearance and when its counters went backwards. On macOS there
are no per-connection counters or RTT (Source::SocketTraffic is missing): arcs are neutral and the legend says so.
Locating, on demand. The Globe row declares sources: Sources::of(&[Source::Locations]). The background thread
reads Locations only while the shown view demands it (Reads::read), so no other view pays for GeoIP. Geo::open
finds the databases but reads none: a city database can exceed 100 MB, so the first lookup of a public address loads
them. Candidates, in order: --geoip PATH, any *.mmdb in ~/.local/share/isotop/, then
/usr/share/GeoIP/GeoLite2-City.mmdb, /var/lib/GeoIP/GeoLite2-City.mmdb, /usr/share/GeoIP/dbip-city-lite.mmdb and
the Homebrew and /usr/local equivalents; failing a city database, the legacy IPv4 and IPv6 country files in
/usr/share/GeoIP. If only one family has a database, the other's addresses are NoDatabase. Results are cached
per address. geo::public removes addresses with no geography before any lookup (private, loopback, link-local,
multicast, unspecified, broadcast, carrier-grade NAT 100.64.0.0/10, IPv6 unique-local and link-local; an IPv4-mapped
IPv6 address is judged as the IPv4 address), which become Location::Private. The status line credits
"IP Geolocation by DB-IP" when that database answers, as its licence requires.
Home from the time zone. geo::home takes --home, or reads the symlink /etc/localtime, extracts the zone name
after zoneinfo/, finds it in zone1970.tab (falling back to zone.tab only when zone1970.tab cannot be read), and
parses the ISO 6709 coordinates ±DDMM[SS]±DDDMM[SS]: for Europe/London, +513030-0000731 is 51.508 N, 0.125 W. The
place is the zone's representative city, not the machine's location. zone1970.tab lists only zones that differ in
post-1970 clock history, and several common zones are merged into others there (Europe/Amsterdam is listed under
Europe/Brussels), so a machine whose /etc/localtime points at such a merged name finds no row and Globe says
"home unknown: pass --home LAT,LON" with home at (0, 0). I checked this against the tz data on a Linux system (the zone is in
zone.tab but not in zone1970.tab) and against the lookup code; I did not run it on a machine with that zone.
Placement and stability. Globe keeps a Seats in one group, home, for every sampled process with a remote
connection, drawn or not, so focus and --limit free no seats; Endpoints are rebuilt every frame from the
snapshot and need no state. Endpoint phase (arc pulse offset, ring angle) is an FNV-1a hash of the rounded place or the
address, so it is stable. The harness finds Globe stable (no known failures).
Camera. The row declares face: Some(globe::face) and turn: Some(Turn { radius: RADIUS, upright }). face
picks the rotation and pitch that bring a point (a searched process, the tour's target) onto the near side; below the
equator the camera's minimum pitch of about 20 degrees limits what can be shown (nothing beyond roughly 70 degrees
south). upright undoes the lean for picking and tour maths. The camera fit uses 64 Fibonacci-lattice points on a
sphere of radius
Time step. No simulation; the earth's turn is stage.time, the pulses are phases of stage.time.
CPU and GPU. The sphere is a world_sphere impostor of exact projected radius facing (visible if in front of the centre
plane or outside the silhouette) before drawing glows. No new primitive.
The coastline file. src/coastline.bin is Natural Earth 110 m coastline: 134 polylines, 5 128 vertices, 20 780 bytes = 134 x 2 + 5 128 x 4. Each polyline is a
little-endian u16 point count followed by that many i16 pairs, longitude and latitude in hundredths of a degree
(so a vertex is accurate to 0.005 degrees, 0.55 km). The longitudes span coastline() parses it once, on first draw.
- A place is a claim. The database's location of an address block, not of the peer: a CDN edge, a VPN exit or an anycast address lands on the operator's registration or an arbitrary city. Many "Amsterdam" endpoints may be one provider.
- Arc length is geodesic distance, not path length. The great circle bounds the path from below; the inspector's RTT is a measured number above the speed-of-light floor for that arc.
- The endpoint's colour is the dominant direction of everything landing there. One heavy upload turns a place pink although most of its sockets are idle. Brightness saturates at about 50 kB/s.
-
Only TCP, only established, only what isotop can see. No UDP (QUIC, DNS, most VoIP), no listening or half-open
sockets, and nothing for processes of other users unless isotop runs as root. A connection to another machine on the LAN
is
privateand circles the pole. - Rates are two-second averages of counter differences, and "up" is acknowledged bytes: a burst appears one scan late and smeared.
-
The ring means "no place yet or ever".
locating N addressesclears as the lookups finish;no GeoIP databasedoes not. The count label is out of sight when the earth is turned to show the south; the legend still says it. - Home is a guess. The time-zone city can be thousands of kilometres from the machine.
- East is on the right and the earth is not tilted by 23.4 degrees. The lean is yours.
./target/release/isotop --demo --view globe --width 1600 --output globe.png --renderer cpu
./target/release/isotop --demo --view globe --home 40.7,-74.0 --time 60 --output globe-ny.png
./target/release/isotop --view globe --geoip ~/.local/share/isotop/dbip-city-lite.mmdb   # live, local database
Press 8 in a session. The demo's home is Amsterdam (52.37, 4.9), its endpoints come from the country table in
places.rs, and its status line says "demo locations". Scroll horizontally to turn the earth and vertically to lean
it, r to let it spin again, g for the tour (which turns the earth to each process). To get places live, install a MaxMind-format
city database in ~/.local/share/isotop/ (DB-IP City Lite works); isotop itself never downloads one.
-
src/globe.rs:Globe::draw,slerp,spin,drift,tilt_of,lean_about_right,upright,face,tangents,coastline,legend; constantsRADIUS,SPIN_SECONDS,COASTLINE. -
src/geo.rs:Geo,locate,legacy_country,public,home,iso6709. -
src/places.rs:COUNTRIES,LEGACY_CODES;src/coastline.bin. -
src/platform/linux/net.rs:sample,tcp_sockets,tcp_socket,diag. -
src/model.rs:Remote,Location,remotes,located, thebackgroundthread,Demand,Reads. -
src/render.rs:Camera::view,Camera::hold,release,Frame::world_sphere;src/views.rs: thegloberow. - Figures:
docs/figures/globe-orthographic.py,globe-arcs.py,globe-rtt.py.
globe::Globe is a ViewModule built from its registry row; views are compile-time modules and there is no plugin system.
-
A day-night terminator.
Snapshot::wallis the wall-clock; the subsolar point follows from the solar declination and the equation of time, and the terminator is the great circle 90 degrees from it. Add the 23.4 degrees of obliquity as a seasonal term. -
RTT as a lie detector. Compare each connection's
tcpi_rttwith the floor$2d,n_g/c$ of its arc and mark those that beat it: anycast and CDN edges would light up. -
More of
tcp_info. Congestion window, retransmissions and the pacing rate would let the pulses show congestion rather than throughput. -
Fix the home lookup for merged zones: fall back to
zone.tabwhenzone1970.tabhas no row for the zone, and resolve the symlink to its target name. -
UDP.
/proc/net/udpandsock_diagfor UDP would reveal QUIC peers, with no byte counters or RTT. - Null Island. An unknown home is drawn at latitude 0, longitude 0, which is open water in the Gulf of Guinea, the place geocoders put what they could not find. Whether it deserves a marker of its own is open.
- Open: should arcs be coloured by the process kind, so the cloud above home and the arcs below it read together?
- J. P. Snyder, Map Projections: A Working Manual, U.S. Geological Survey Professional Paper 1395, 1987 (the orthographic equations).
- K. Shoemake, "Animating rotation with quaternion curves", SIGGRAPH '85, 1985 (slerp).
- R. W. Sinnott, "Virtues of the Haversine", Sky and Telescope 68(2), 1984, p. 159.
- V. Jacobson, "Congestion avoidance and control", ACM SIGCOMM '88, 1988. V. Paxson, M. Allman, J. Chu, M. Sargent, RFC 6298, "Computing TCP's Retransmission Timer", 2011. M. Mathis, J. Heffner, R. Raghunarayan, RFC 4898, "TCP Extended Statistics MIB", 2007.
- MaxMind DB File Format Specification (MaxMind); Natural Earth (public domain physical vectors, 1:110m coastline);
the IANA time zone database (
zone1970.tab,zone.tab); ISO 6709 (coordinate representation). - Linux manual pages
sock_diag(7)andtcp(7)(TCP_INFO). - Related pages: Theory: Camera and projection, Theory: Background sampler and demand, Theory: Sampling on Linux, Theory: Picking.