Repository navigation
Math Reaction Diffusion
Two chemicals that react with each other and diffuse at different speeds can turn a perfectly uniform dish into spots, stripes and mazes. Alan Turing showed in 1952 that this needs nothing but the arithmetic of a linearised system; John Pearson showed in 1993 that a two-line model (Gray-Scott) holds a zoo of such patterns in a single parameter plane. This page derives the instability condition, works through the Gray-Scott model, and shows what the plane looks like, with every number computed by the stdlib Python scripts in docs/figures/. isotop does not run any of this yet: the model is the engine of the specified Planned-Morph view, and the page says plainly where the theory ends and the design begins.
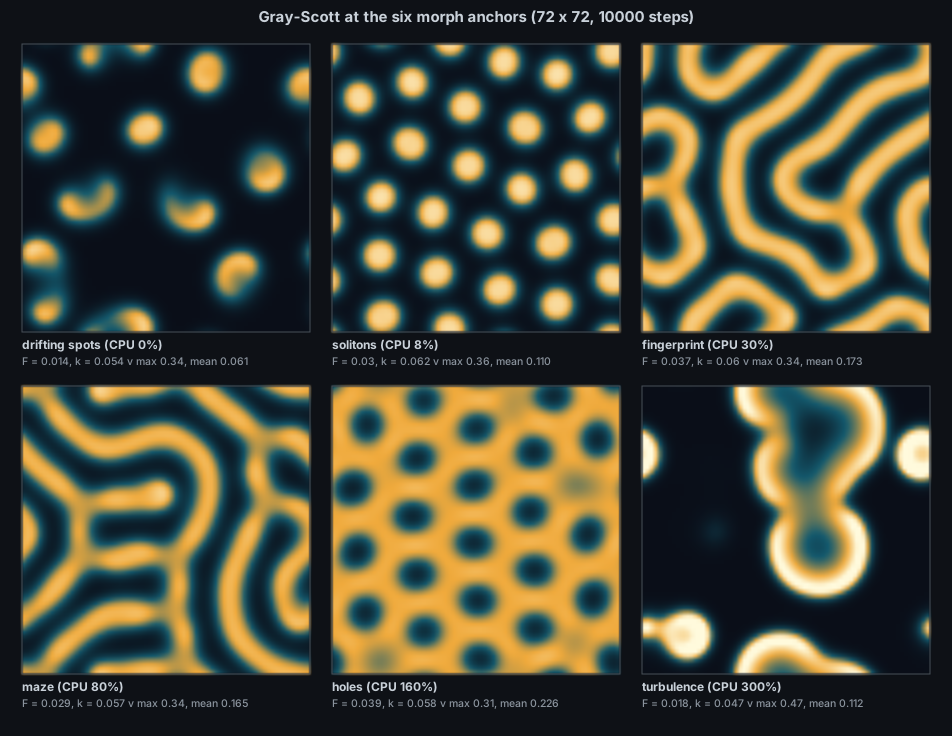
The six anchor points of the morph brief, simulated by docs/figures/reaction-diffusion-patterns.py (72 x 72 periodic dish, 10000 steps, activator $v$ shown). Left to right, top to bottom: drifting spots, solitons, fingerprint, maze, holes, turbulence.
Turing. Alan Turing published "The chemical basis of morphogenesis" in Philosophical Transactions of the Royal Society of London B in 1952, while at Manchester, and died in 1954. He asked how a ball of identical cells breaks symmetry, answered with the linear argument of section 1, and supplemented it with calculations on the Manchester computer. The paper was largely ignored by biologists for two decades. Hans Meinhardt and Alfred Gierer gave it a biologist's form in 1972 (a short-range activator and a long-range inhibitor), and the first laboratory Turing patterns in a chemical system waited until 1990, in a chlorite-iodide-malonic acid reaction (Castets and co-workers; Lengyel and Epstein, 1991).
Chemical clocks. The chemistry that made a reaction-diffusion dish plausible had its own trouble getting a hearing. Boris Belousov found an oscillating reaction in the early 1950s; reviewers rejected his manuscripts on the ground that a closed reaction could not oscillate, and he published only a brief abstract in a collection on radiation medicine. Anatol Zhabotinsky took the reaction up in the 1960s, and the Belousov-Zhabotinsky reaction became the standard example of chemical waves and spirals.
Gray and Scott. Peter Gray and Stephen Scott studied the autocatalytic step
Alan Turing, "The chemical basis of morphogenesis" (Philosophical Transactions of the Royal Society of London B 237, 1952), asked how a ball of identical cells could break symmetry. His answer: let
Let $(u^, v^)$ satisfy
Perturb the state by
The growth rate
-
Stable without diffusion (
$q = 0$ ):$\operatorname{tr} J < 0$ and$\det J > 0$ . -
Trace stays negative with diffusion.
$\operatorname{tr}(J - q^2 D) = \operatorname{tr} J - q^2 (D_u + D_v)$ is always more negative than$\operatorname{tr} J$ , so a complex pair can never cross into instability through the trace. Stability can only be lost by a real eigenvalue crossing zero, that is by$\det(J - q^2 D) < 0$ . - Expand the determinant. With $J - q^2 D = \begin{pmatrix} f_u - D_u q^2 & f_v \ g_u & g_v - D_v q^2 \end{pmatrix}$,
At threshold the critical wavenumber is
Gierer and Meinhardt (1972) turned the argument into a concrete activator-inhibitor model of biological patterning (Kybernetik 12). Kondo and Asai (1995, Nature 376) saw stripes on the marine angelfish Pomacanthus migrate and rearrange in the way a reaction-diffusion simulation predicts; Kondo and Miura (2010, Science 329) review the evidence. The first laboratory Turing patterns in a chemical system appeared in the 1990s (Castets et al. 1990, Physical Review Letters 64; Lengyel and Epstein 1991, Science 251). Whether any given animal pattern is "really" Turing's mechanism is an open empirical question; the mathematics does not depend on the answer.
The Gray-Scott model (Gray and Scott 1983, 1984, in Chemical Engineering Science, for the autocatalytic reaction
The trivial state
Non-trivial states satisfy
They exist only if
which peaks at
Using
So the state loses stability to oscillations (a Hopf bifurcation) where
It meets the saddle-node curve at
In lattice units (grid spacing 1, time step
Explicit Euler is stable for the diffusion part when
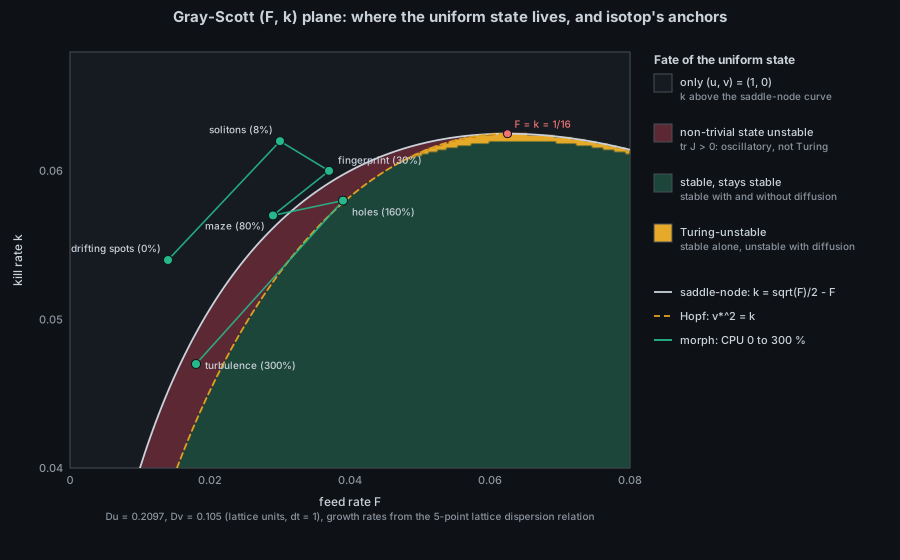
docs/figures/reaction-diffusion-plane.py. Each pixel is classified from the lower-$u$ non-trivial state, with the 5-point lattice dispersion relation at $D_u = 0.2097$, $D_v = 0.105$. Aqua line: the path of the morph view's CPU interpolation, anchors dotted.
What the figure shows, and what it does not:
| Region | Shown colour | Meaning |
|---|---|---|
| dark | only the trivial state exists (and it is stable) | |
| between saddle-node and Hopf | red-brown | a non-trivial state exists but is unstable without diffusion ( |
| right of the Hopf curve | green | the non-trivial state is stable, with and without diffusion |
| a thin sliver near |
amber | Turing-unstable: stable alone, unstable with diffusion (about 0.6 % of the plotted area) |
The six isotop anchors, checked against these curves:
| Anchor | CPU % | Non-trivial state? | |||
|---|---|---|---|---|---|
| drifting spots | 0 | 0.014 | 0.054 | 0.0452 | none ( |
| solitons | 8 | 0.030 | 0.062 | 0.0566 | none |
| fingerprint | 30 | 0.037 | 0.060 | 0.0592 | none |
| maze | 80 | 0.029 | 0.057 | 0.0561 | none |
| holes | 160 | 0.039 | 0.058 | 0.0597 | exists, lower branch |
| turbulence | 300 | 0.018 | 0.047 | 0.0491 | exists, lower branch |
The conclusion is worth stating bluntly. None of the six isotop anchors is a classical Turing pattern. Four have no non-trivial uniform state at all; the trivial state is the only uniform state and is stable, so the spots, solitons, fingerprints and mazes grow from finite-amplitude nuclei by front propagation (a spot grows, splits, and the fronts fill the dish). The other two have an unstable non-trivial state. The name "Turing patterns" is therefore a loose label for "reaction-diffusion patterns of an activator-substrate system"; the genuinely linear Turing region exists (amber, at
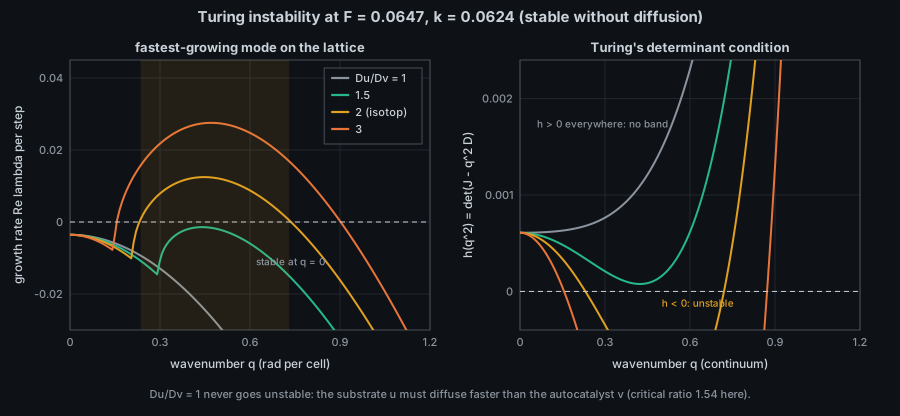
docs/figures/reaction-diffusion-dispersion.py, inside the amber sliver at $(F, k) = (0.0647, 0.0624)$.
At this point
- Wavelength is set by the chemistry, not the dish. Enlarging the dish adds more spots or stripes, not larger ones.
-
Time scale is thousands of steps. In the patterns figure, 10000 steps at
$\Delta t = 1$ are needed before the six anchors look settled on a 72 x 72 dish; maze and turbulence continue to evolve. -
Starvation is fast. Switching a settled periodic 64 x 64 test patch to
$F = 0$ ,$k = 0.06$ (the exit rule of the specified view) drops$\max v$ from$0.3$ to$0.4$ to below$0.01$ in under 100 steps for every anchor state I tried (spots, solitons, maze, holes, turbulence): with$F = 0$ the substrate is never replenished, the term$v(uv - k)$ turns negative, and$v$ decays at about$k$ per step. In a real dish the edge of the patch is coupled to live neighbours, so the observed starvation near borders can be slower. This test is a patch alone; it is not a measurement of any isotop code. -
Noise-free runs are deterministic. The figure scripts seed with a splitmix64 stream, the same family as isotop's
simulation::Rng; two runs are bit-identical.
Everything in this section is the specified design of Planned-Morph (issue #50); no src/morph.rs exists yet.
- The dish is a fixed 256 x 256 grid with zero-flux edges (the prototype in
docs/mockups/code/morph.pywraps instead; the issue wins), Sims's 9-point kernel with$D_u = 0.699$ ,$D_v = 0.35$ ,$\Delta t = 1$ , stepped bysimulation::FixedStepat 240 steps per second of view time. - Per-cell
$F$ and$k$ come from each process's CPU through the anchor table above, interpolated on$\log(1 + \text{cpu})$ and blurred with a Gaussian of$\sigma \approx 1.5$ cells across patch borders. - The picture lets a viewer infer only a coarse ordering: more CPU moves the patch along the aqua path in the plane, from isolated spots through stripes to holes and boiling. It does not let a viewer read CPU off the pattern, because the mapping from
$(F, k)$ to morphology is not monotone in any single feature (the path doubles back in$F$ between 160 % and 300 %).
python3 docs/figures/reaction-diffusion-plane.py        # about 1 s
python3 docs/figures/reaction-diffusion-dispersion.py   # about 1 s, prints the numbers quoted above
python3 docs/figures/reaction-diffusion-patterns.py     # about 3 minutes (single process pool of 4)
The simulator is docs/figures/rdsim_w8.py (explicit Euler, 5-point stencil, periodic, standard library only).
- Nothing in
src/implements reaction-diffusion yet. The planned module issrc/morph.rs(Planned-Morph). - The nearest existing precedent for a pure grid simulation is
src/medium.rs(the Ripple wave equation, see Math-Wave-Equation); the fixed-step clock issimulation::FixedStepinsrc/simulation.rs(see Theory-Simulation-Toolkit). - The prototype with the anchor table and the power-diagram patches is
docs/mockups/code/morph.py(numpy and scipy; reference only).
- Run the six anchors with the 9-point kernel and compare the wavelength and the isotropy of the spot lattice.
- Find the isotop CPU path's nearest approach to the Turing sliver and ask whether a different anchor table would pass through it.
- Measure how many dt-1 steps a 256 x 256 dish needs to settle a maze from 8 nuclei, and compare with the 1500 settle steps specified.
- Zero-flux versus periodic edges: does clamping change which pattern a small patch picks?
- A. M. Turing, "The chemical basis of morphogenesis", Philosophical Transactions of the Royal Society of London B 237 (1952) 37-72.
- A. Gierer and H. Meinhardt, "A theory of biological pattern formation", Kybernetik 12 (1972) 30-39.
- P. Gray and S. K. Scott, "Autocatalytic reactions in the isothermal, continuous stirred tank reactor: isolas and other forms of multistability", Chemical Engineering Science 38 (1983); and "... oscillations and instabilities in the system A + 2B -> 3B; B -> C", Chemical Engineering Science 39 (1984).
- J. E. Pearson, "Complex patterns in a simple system", Science 261 (1993) 189-192.
- S. Kondo and R. Asai, "A reaction-diffusion wave on the skin of the marine angelfish Pomacanthus", Nature 376 (1995) 765-768; S. Kondo and T. Miura, "Reaction-diffusion model as a framework for understanding biological pattern formation", Science 329 (2010) 1616-1620.
- K. Sims, "Reaction-Diffusion Tutorial" (web page, 2013); R. Munafo, "xmorphia" (web pages).
- J. D. Murray, Mathematical Biology II: Spatial Models and Biomedical Applications (Springer, 3rd ed. 2003), the chapter on pattern formation.