Repository navigation
View City
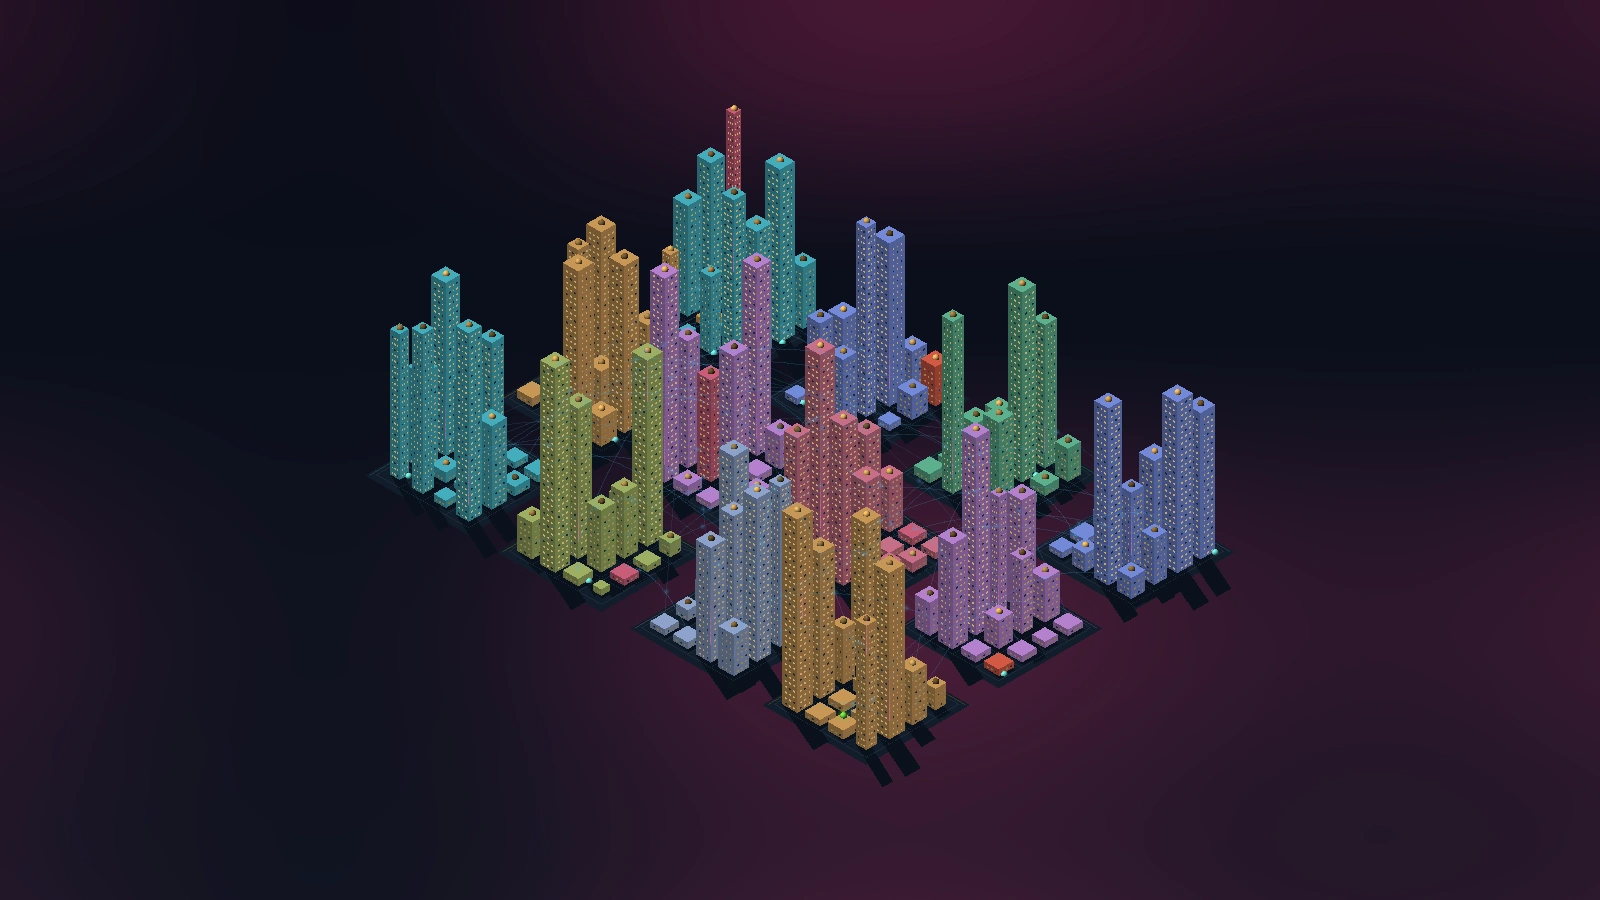
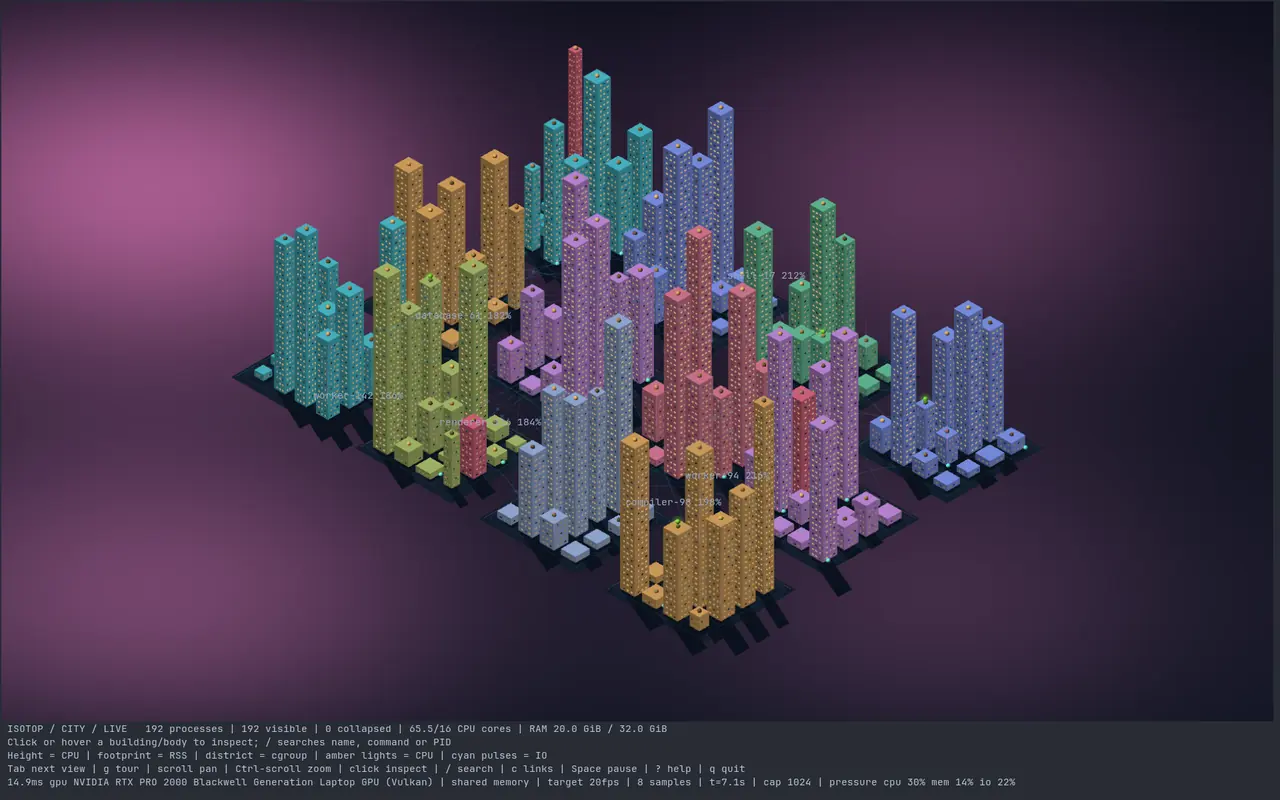
The machine as a skyline. Each process is a building on a fixed plot; its height is its CPU use, its footprint is its resident memory, and its district is the service (cgroup) it belongs to. Windows glow with activity, rooftop lights pulse on busy buildings, and the whole thing is seen through an orthographic isometric camera, so the vertical axis is drawn at the same scale as the ground. It is the first view (1, or the default of --view) and the plainest: a 3D bar chart arranged into neighbourhoods. It is also deliberately not a treemap, and the reason it is not is the most interesting thing about it.
A city is a good picture of a process table because the two share a structure. Land is divided into parcels by a cadastre that does not change when a building does: a plot keeps its address while the building on it is torn down and rebuilt. Parcels are gathered into districts, which is how a services table is organised (a service owns its processes). Buildings differ in how much ground they take (a footprint) and how high they reach, and the eye reads a skyline instantly as a distribution: many low blocks, a few towers. Software visualisation has used the metaphor for a long time (Wettel and Lanza, CodeCity, 2007: packages as districts, classes as buildings, methods as height); isotop borrows it for a live system.
Why not a treemap? The standard tool for "a hierarchy with a size at each leaf" is the treemap (Johnson and Shneiderman 1991; Shneiderman 1992): fill a rectangle, divide it among the children in proportion to their sizes, recurse. It is space-filling and encodes size as area. Two properties make it a poor fit here:
- Instability. Slice-and-dice and squarified layouts (Bruls, Huizing and van Wijk 2000) place every cell as a function of every other cell's size. When the sizes are sampled once a second and change by percent each time, the layout reshuffles continuously; the cure literature (ordered treemaps, Shneiderman and Wattenberg 2001) reduces but does not remove it. isotop's invariant is the opposite: a process keeps its place when CPU, memory or the population changes (Theory Stable Layout).
- Area is a weak channel. Cleveland and McGill (1984) ranked the elementary perceptual tasks by accuracy: position along a common scale, then along non-aligned scales, then length, direction and angle, then area, then volume and shading. An area-coded value is read less accurately than a length-coded one, and the quantity that changes fastest, CPU, deserves the better channel.
The City is closest to a quantum treemap (Bederson, Shneiderman and Wattenberg 2002): every leaf occupies exactly one fixed-size cell, a quantum, and the data are carried by something other than the cell's area. Here the cell is the 4 by 4 plot, and the data go into the third dimension (height) and into the size of the building inside its plot.
The thing City draws is the planned city: land divided into equal parcels before anyone builds on it.
- Rectilinear street plans are older than any name attached to them. Excavated cities of the Indus valley such as Mohenjo-daro (third millennium BCE) show blocks laid out on a grid, and Greek colonies used regular plots from the seventh century BCE onward. Historians treat "the first grid" as an unanswerable question.
- The tradition names Hippodamus of Miletus (fifth century BCE) as its inventor, on the authority of Aristotle, who says in the Politics that Athens had him plan the Piraeus. Modern scholarship disputes the invention and the attribution of other cities to him, and some argue his real contribution was theoretical: a division of a city into classes of land and people. Aristotle also records that he wore his hair long, wore costly ornaments, and dressed in the same cheap warm cloak in winter and summer.
- Roman town planning combined a rectilinear grid with a forum at its centre and a wall around it, and carried the plan across the empire. The Spanish crown's colonial ordinances of the sixteenth century did the same for a new continent (the grid-and-plaza pattern of Spanish American towns).
- Two nineteenth-century plans are the usual modern exhibits. The Commissioners' Plan of 1811 laid a grid of avenues and numbered streets over Manhattan above Houston Street, on a survey by John Randel Jr., and critics have objected to its rigidity ever since. Ildefons Cerda's plan for the Eixample of Barcelona (late 1850s) also drew on the Hippodamian model, with equal blocks and chamfered corners, and was much altered by landowners and speculation afterwards.
- The step from the plan to the metaphor in software is recent: Wettel and Lanza's CodeCity (2007) drew classes as buildings and packages as districts. City differs from that line in one respect it shares with the cadastre, not the skyline: a parcel keeps its address when the building on it changes.
- Nobody has yet determined whether a district of sixteen is closer to a Roman insula or to a block of the Eixample; the tallest buildings in both are the exceptions.
Stevens (1957) modelled the apparent magnitude of a stimulus as a power law of its physical magnitude,
Two caveats the ranking does not cover. First, the bars are in three dimensions, and in 3D the bases are at different screen heights, so the comparison is a length on non-aligned scales, which Cleveland and McGill rank below position on a common scale. Second, occlusion: at isometric pitch (render::ISOMETRIC) a tower of height Q, e), tilts (PgUp, PgDn) and flips top-down (t).
Camera::view maps a world point pitch) and the world turned 45 degrees, the horizontal screen coordinate is SCALE
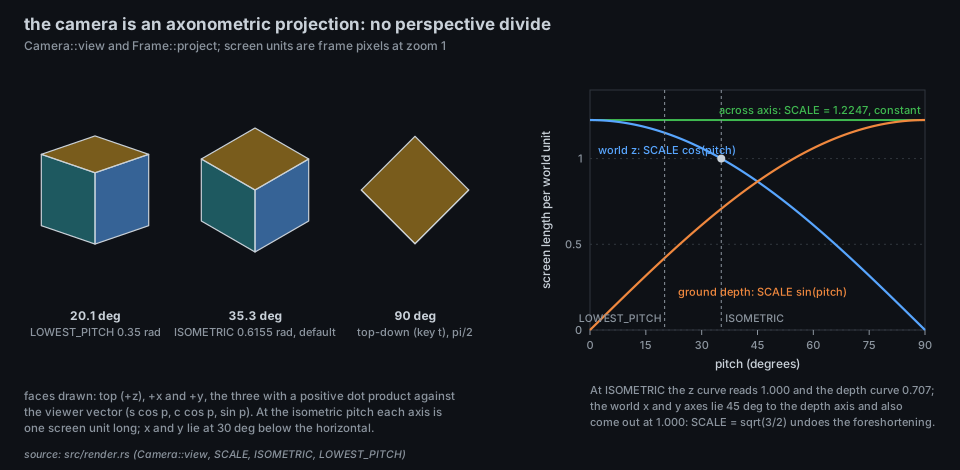
Tilting to the lowest allowed pitch (LOWEST_PITCH = 0.35 rad, 20 degrees) stretches a unit of height to
Both data channels pass through a rectangular hyperbola model::bounded), the Michaelis-Menten form: linear near zero with slope
- Height
$= \big(1 + 44,b(\mathrm{cpu},100)\big)\cdot\mathrm{grow}$ world units, CPU in percent of one core (100 is one core), so a busy core is half-height: 23 units, 5.75 plots. The asymptote is 45 units (11 plots). - Half-side
$= \big(0.42 + 1.05\sqrt{b(\mathrm{MiB},220)}\big)\cdot(0.35 + 0.65,\mathrm{grow})$ , so the building is a square of side$2\times$ that: 0.98 units at 1 MiB, 2.33 at 220 MiB, 2.75 at 1 GiB, at most 2.94 at the limit, inside a 4-unit plot (a 54% fill at most).
What resolution does the display keep? The derivative of height is
| memory | side (units) | area (units squared) | area against 1 MiB |
|---|---|---|---|
| 1 MiB | 0.98 | 0.96 | 1.0 |
| 12 MiB | 1.32 | 1.74 | 1.8 |
| 100 MiB | 2.01 | 4.06 | 4.2 |
| 1 GiB | 2.75 | 7.54 | 7.8 |
| 16 GiB | 2.93 | 8.56 | 8.9 |
A factor of 1000 in memory (1 MiB to 1 GiB) is a factor of 7.8 in area, 2.8 in side. With the Stevens exponent of 0.7 for apparent area the viewer would perceive
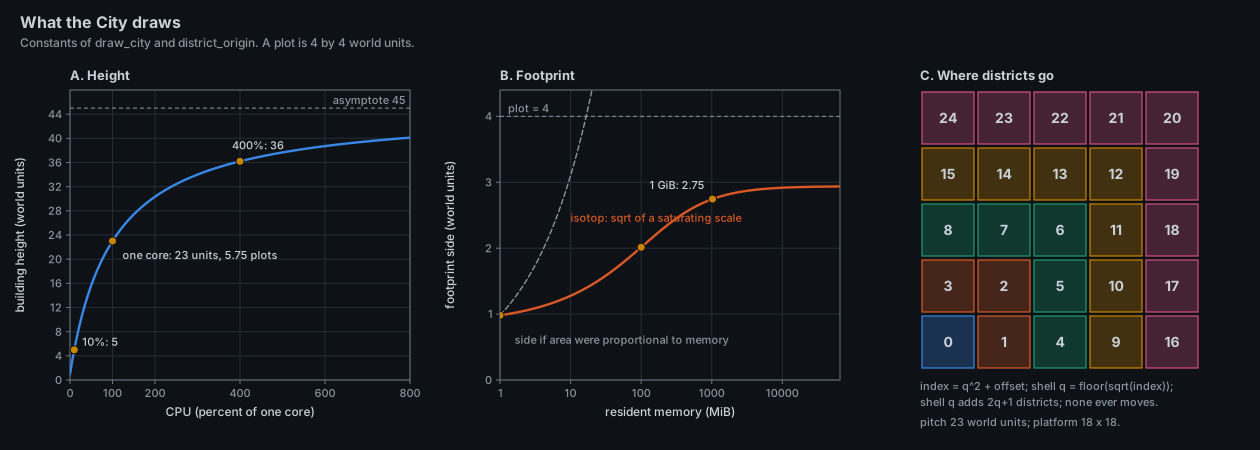
Panel C is the district fill order described under How isotop realises it.
| Visual element | Measured quantity (platform source) | Transform | Status |
|---|---|---|---|
| Building height | CPU per cent of one core (Linux: /proc/<pid>/stat utime+stime ticks; macOS: Mach time), counter delta over the sample interval |
model::measure, then Scene::ease; |
measured, smoothed |
| Footprint (square) | resident memory (Process::memory: RSS on Linux, physical footprint on macOS), eased by |
|
measured, compressed |
| District |
Process::group: Linux, the nearest .service or .scope of the unified cgroup path (else the last path component, else "ungrouped"); macOS, the outermost .app bundle or the executable name |
one 16-plot block per 16 members | measured grouping |
| Plot within a district | none | lowest free slot of 16 at the time of arrival, row-major | decorative (arrival order) |
| District colour | none |
DISTRICTS[district_index % 8] (8 colours, cycling): a district with more than 16 members is several blocks of different colours |
decorative |
| Pink / orange / red building | process state Z / T or t / D
|
replaces the district colour | measured; no D on macOS |
| Wall shading | none | four sides at 0.40, 0.66, 0.55, 0.30 of the colour, roof at 0.95 | decorative lighting |
| Cast shadow | the height | dark quad skewed by |
decorative, redundant with height |
| Windows (only at zoom above 3) | CPU for brightness; height for the count |
|
count redundant with height, brightness measured, which ones are lit decorative |
| Amber rooftop light | CPU above 1% | a pulsing sphere, |
measured on/off; pulse decorative |
| Green beacon | NVIDIA per-process GPU memory present (NVML) | glow and sphere on the roof | measured; absent on macOS |
| Cyan pulse at the foot | storage I/O rate above 1024 bytes per second (Linux /proc/<pid>/io; macOS rusage) |
a sphere sliding along the building's base edge | measured on/off |
| Arcs and pink beams | socket links; connections leaving the machine | arcs lifted 1.5 above the roof, as in Orbit | measured |
| Rise on birth | a process appearing | height and footprint grow over 0.9 s (cubic ease-out) | measured event |
| Ring on exit | a process vanishing | an expanding ring and glow where it stood, 1.2 s | measured event |
City is a ViewModule in src/views/city.rs: the state struct City owns the seating, and City::draw calls City::place to seat every admitted process before drawing the districts and buildings. Its registry row in views::REGISTRY builds it with a closure (Box::new(city::City::default())), so Scene holds no City state.
Seating. City keeps plots (identity to district and slot), groups (group name to its districts, in order) and occupancy (per district, slot to identity). A process already seated keeps its plot. A newcomer scans its group's districts in order for the lowest free slot of 16; if none, it opens a new district at the end. A process that exits frees its slot (occupancy[district].remove), which the next newcomer of the same group will take. District blocks are never freed, so a district's index and place never change. Admitted processes are visited in Identity order (pid, then start time), so on a cold start the seats are in pid order. The slot
Where districts go. district_origin(index) fills square shells: with
Time. Resource figures come eased (Scene::ease: Stage::resources. City uses stage.time for its animations and does not step anything with stage.dt.
Growth. simulation::growth is a cubic ease-out over GROW_SECONDS = 0.9 s, applied as height Scene::intro so the processes already running when it starts bloom as well.
Draw order and picking. Platforms and grid lines, then for each building a shadow, four walls (and windows), the roof, the rooftop light, the beacon and the I/O sphere. Walls, windows and roof carry the process index into frame.identities; platforms and shadows carry NONE. positions[id] is the plot centre on the ground, which is what the tour, labels and the exit flash read. The depth buffer resolves occlusion; the pick buffer follows, so a click lands on whatever building is in front.
Fit. Scene::fit frames the districts' ground positions and leaves vertical headroom of tallest is the tallest building of the last frame, which City::draw writes back through Stage::headroom.
CPU and GPU. Everything is quads, lines and sphere impostors on the shared display list, so there is no special parity case.
Stability. The harness checks the contract and the City has no waived property: city_does_not_relocate_when_resources_or_population_change and the shared harness enforce it, and focusing a subtree or lowering --limit hides buildings but frees no plot (clearing the focus restores them).
What degrades where. No optional source is read (the view declares none): the demand is empty. Without NVML there are no green beacons. On macOS state D is never reported, memory is the physical footprint, districts are app bundles, and there is no GPU beacon; everything else is as on Linux. When cgroup v2 is missing on Linux, Process::group is still the service named in /proc/<pid>/cgroup.
What the demo render shows (--demo --view city --width 1600 --output ...): twelve districts forming a --time 12 has a median of about 5.7% (a block under one plot tall), a mean of about 32% and a maximum of 312% (a tower of 8.6 plots). Pink, orange and red buildings are zombie, stopped and blocked processes. Rooftops carry small amber lights; walls carry rows of warm windows; faint cyan arcs link some buildings. The surroundings are a violet dusk sky whose haze reflects the demo's pressure.
You can infer
- The ranking of CPU between processes, from height, with the best accuracy in the lower half of the curve (below one core).
- Order of magnitude of memory, and the biggest of a district, from the footprint.
- Who belongs together: the district.
- State anomalies: colour overrides make stuck (red), stopped (orange) and zombie (pink) processes stand out.
- Births and exits: a rising building and an expanding ring.
You cannot infer
-
Instantaneous CPU. The height is an exponential average (1.5 s, then 0.3 s) of a tick delta over the sample interval (1 s by default); a 100 ms burst does not appear. The first sample of a new process carries no CPU rate and is drawn at the floor (the code leaves
cpuat 0). - CPU above about 400%. The curve saturates; multi-core work looks alike beyond it.
- Memory exactly. A building at 1 GiB is only 2.8 times as wide as one at 1 MiB.
- Anything from the position within a district or from the colour of a district. Both are arrival order and a cycling palette.
- Which window is lit. The pattern comes from a hash of the pid and a level and column index.
- What stands behind a tall building. Rotate or go top-down.
- Age. Pid order seeds the slots at start, but slot reuse scrambles it.
Resolution. A 1600-pixel render fits about twelve districts, so a building is on the order of 20 to 30 pixels wide and a one-pixel step in height is about 0.5% CPU near idle (zoom 5); the terminal's own cell grid is coarser, but with SGR-pixel mouse reporting (Ghostty, Kitty) hover is pixel-exact.
./target/release/isotop --demo --view city
./target/release/isotop --demo --view city --width 1600 --output city.png --renderer cpu
./target/release/isotop --demo --view city --processes 600 --width 1600 --output big.png
./target/release/isotop --view city                       # live
Keys: 1 selects it; t toggles top-down and isometric; Q and e rotate a quarter turn; PgUp and PgDn tilt; Ctrl-scroll zooms (windows appear above zoom 3); f focuses the selected process and its descendants (the rest are hidden, not moved); c cycles the link arcs; click selects, hover names. --limit N caps admitted processes (default 1024).
-
src/views/city.rs:City,City::place,City::draw,district_origin,draw_district,draw_building,draw_windows,Plot; testscity_does_not_relocate_when_resources_or_population_change. -
src/render.rs:Scene::fit,Scene::ease,admitted,Stage::headroom. -
src/model.rs:bounded,measure(CPU rate and its smoothing),Process. -
src/palette.rs:DISTRICTS,process_color,tint. -
src/simulation.rs:growth,GROW_SECONDS,smoothing. -
src/views.rs: thecityrow (LinkRule::All,link_lift1.5,Backdrop::Dusk); the legend isCity::legend. -
src/platform/linux/mod.rs:cgroup_name,classify;src/platform/macos/logic.rs:group. - Figure script:
docs/figures/city-encodings.py.
-
A second channel for the same height. Split each tower into a lower part for kernel time and an upper one for user time:
Process::system_sharealready carries the split (Linux and macOS). A tower that is mostly system time is a different animal from one that is mostly user time. - Honest area. Make the footprint area proportional to memory over a bounded range (say a logarithm over 1 MiB to 16 GiB) and let the plot grow with the district when a process exceeds it: a true quantum treemap with variable quanta. What does the stability invariant cost?
- Hue for memory. Reserve the walls' lightness for memory rank and put the district identity in the platform colour only, so footprint is a redundant channel with a better-known ordering (lightness is rank-ordered; hue is not).
-
Resolve the saturation. Replace the hyperbola by
$\log(1+u/K)$ above one core so multi-core work separates; compare the histogram of the displayed variable (an entropy view of the transform): the best transform for a heavy-tailed variable maps its quantiles evenly onto pixels. - Windows that mean something. Make the lit count proportional to thread count or to runnable threads; at present they are texture.
- Open: is 16 the right quantum? A cgroup of 17 processes costs a whole 16-plot district, almost empty. Cells of 12 or 25 would trade the look of a square block against waste.
- B. Johnson and B. Shneiderman, "Tree-Maps: a space-filling approach to the visualization of hierarchical information structures", Proc. IEEE Visualization '91 (1991), 284-291.
- B. Shneiderman, "Tree visualization with tree-maps: 2-d space-filling approach", ACM Transactions on Graphics 11(1) (1992), 92-99.
- M. Bruls, K. Huizing, J. J. van Wijk, "Squarified treemaps", Data Visualization 2000 (Springer, 2000), 33-42.
- B. Shneiderman and M. Wattenberg, "Ordered treemap layouts", Proc. IEEE Symposium on Information Visualization (2001), 73-78.
- B. B. Bederson, B. Shneiderman, M. Wattenberg, "Ordered and quantum treemaps: making effective use of 2D space to display hierarchies", ACM Transactions on Graphics 21(4) (2002), 833-854.
- W. S. Cleveland and R. McGill, "Graphical perception: theory, experimentation, and application to the development of graphical methods", Journal of the American Statistical Association 79(387) (1984), 531-554.
- S. S. Stevens, "On the psychophysical law", Psychological Review 64(3) (1957), 153-181.
- J. Mackinlay, "Automating the design of graphical presentations of relational information", ACM Transactions on Graphics 5(2) (1986), 110-141.
- R. Wettel and M. Lanza, "Visualizing software systems as cities", Proc. IEEE International Workshop on Visualizing Software for Understanding and Analysis (VISSOFT) (2007), 92-99.
- E. R. Tufte, The Visual Display of Quantitative Information (Graphics Press, 1983).