Repository navigation
Theory Model and Rates
The platform samplers hand the model a list of RawProcess values: cumulative counters and instantaneous gauges.
model.rs turns them into a Snapshot, the only thing the rest of the program sees. The turning is mostly one
operation, differencing a counter over the time since the last reading, and one filter, an exponential
smoother with a 1.5 second time constant. This page derives that filter exactly (step response, frequency
response, delay), says what quantisation and aliasing do to a rate estimated this way, states the rule that makes
absence a first-class value ("unknown is not zero"), and describes the budgeted selection top_n and the
deterministic demo workload that every screenshot in this wiki is rendered from. The sources of the raw numbers are
on Sampling on Linux and on macOS.
Counters and averages. Differencing a cumulative counter is how Unix has always reported CPU use: the kernel keeps totals and the tool subtracts. The smoothing is older than computers. Exponential smoothing came out of Robert G. Brown's work as an operations analyst for the US Navy in the Second World War, which he presented in 1956 for inventory demand, and of Charles C. Holt's independent report for the Office of Naval Research (ONR Report 52, 1957), which went unpublished until 2004. The idea of an exponentially decaying window is older still: Wikipedia's article on it attributes the window function to Poisson, as an extension of a numerical analysis technique from the seventeenth century. Sources differ on how much of this belongs to each man, and isotop's filter needs only the result, a weight of 1 - exp(-dt/tau) that makes the filter independent of the sampling interval.
Aliasing. The sampling theorem the aliasing section leans on is cited in the references as Shannon (1949); the folding of frequencies above the Nyquist limit is the same arithmetic whether the signal is a radio wave or a compile job.
In this project. The 1.5 s smoother is already in the first commit (2026-10-07), written inline as 1 - exp(-dt / 1.5). Making absence a value of its own, the "unknown is not zero" rule, landed on 2026-10-11 in the architecture batch #113, and the deterministic demo workload took its present form with the demo options in #120 the same day. This page derives what the constant does rather than why 1.5 was chosen, and the log does not say.
Identity { pid, start } is the key for everything that persists between samples. start is a Linux
starttime in ticks since boot, or a macOS start time in microseconds since the epoch; either way a recycled pid has
a different start, so state keyed by Identity can never be inherited by a newcomer. Identity orders by pid then
start; that total order is the tie-break in top_n, the sort order of Snapshot::processes, and the merge key of
History.
Process is one row. Its fields fall into three groups:
| group | fields | filled by |
|---|---|---|
| read directly (gauges) |
id, parent, name, command, group, kind, state, memory, threads, core, cgroup, priority, nice, policy, written, started
|
the platform, in RawProcess::process
|
| derived from counters |
cpu, cpu_time, io_rate, read_rate, write_rate, system_share, performance_share, waiting, syscall_io, major_faults
|
measure in model.rs
|
| from the background thread |
files, locks_held, blocked_on, gpu_memory, and, while their sources are demanded, oom, memory_detail and thread_list (and the snapshot's links, remotes, units, pipes, unix_queues and kernel counters) |
merge, by Identity (background sampler) |
A field added to Process must be decided in four exhaustive struct literals (parse_stat on Linux,
Sampler::process on macOS, demo_with and Transient::process in the demo): no ..Default::default(), so the
compiler forces the question "what is this field where it cannot be measured?".
Snapshot is one sample: the processes sorted by Identity, memory totals, cores, elapsed (seconds on the
monotonic clock since the collector started, the clock every window and history is expressed in), wall (the
calendar time, seconds since the Unix epoch; in the demo DEMO_EPOCH + time), the three pressure percentages, the
socket-derived links and remotes, the Cpu list, the cgroup Units, missing and sources
(the two sets), the sampler's
health, the life events since the previous sample, journal (the log lines delivered while it was the newest sample), the kernel counters (interrupts, softirqs, oom_kills; Pending, Pending and None until a view demands them), and observer, isotop's own row.
Measured<T> is for values measured on the background thread: Pending (not yet; before the first pass, or a
process born since, or one a budget-limited scan has not reached), Unreadable (could not be read, normally for
lack of permission), Known(T). A view that must tell the two apart uses it; everything else is an Option.
One call, on the frame loop, in this order:
-
dt = max(now − last, 0.001)seconds from the monotonicInstants of this and the previous call. - System readings: pressure, memory, core count;
elapsed,wall. - For each
RawProcessof the sampler:measure(raw, previous.get(id), hz, dt), which returns the finishedProcessand theCountersto keep for next time. The map of kept counters is keyed byIdentityand rebuilt every sample, so it only ever holds the processes alive now. - Per-CPU readings (
Sampler::cpus(dt)), after the processes, because macOS derives its cluster clocks from the process counters just read. -
missing,per_cluster,unreadableandshadowsfrom the sampler; processes sorted byIdentity. - Publish the cgroup paths and the
pid → Identitymap for the background thread; on the first call, start it. - Merge the latest background
Extras. - Find isotop's own process (the observer).
- If life events are demanded, drain the event queue and merge it with sample diffing (Life events); otherwise reset that state, which ends the event thread.
dt is measured at the start of the call, but the counters of the first process in the sweep are read at
slightly different instants than those of the last. The error, relative to dt, is the sweep duration over
--sample-ms. It is small at the default and grows as --sample-ms shrinks. It also means that the effective
sampling interval is not exactly --sample-ms: the main loop checks the sample clock once per frame, so the next
sample comes at the first frame boundary at or after --sample-ms, plus the duration of the sample itself. This is
why rates are divided by the measured dt, never the nominal one.
For a cumulative counter
| quantity | formula |
None (or special) when |
|---|---|---|
cpu (% of one core, may exceed 100) |
|
not an Option: reads 0.0 on a process's first sample; a backwards counter saturates to a zero raw reading |
cpu_time (s) |
ticks / hz | always known |
io_rate, read_rate, write_rate (B/s) |
$\Delta$bytes$/\Delta t$ | first sample; I/O unreadable; either counter went backwards (the total would be wrong) |
syscall_io (B/s and calls/s) |
|
first sample; unreadable; reset; any counter backwards; always on macOS |
major_faults (/s) |
first sample; reset; backwards | |
system_share (0–1) |
|
first sample; no CPU time elapsed; reset |
performance_share (0–1, macOS) |
|
first sample; no CPU time elapsed; a counter backwards; Linux |
waiting (threads, macOS) |
growth of runnable minus CPU beyond its high-water mark, per second, at most the thread count | first sample; reset; Linux |
remote up, down (B/s) |
per socket inode, |
new socket; backwards; macOS (counters are placeholders) |
loopback link_traffic (B/s) |
per pid pair, received bytes of both ends | the first scan; absent pairs, not zeros |
cgroup Unit::cpu (%) |
first reading; counter backwards | |
Cpu::busy (0–1) |
busy ticks over total ticks | first reading; no ticks; counter backwards |
Cpu::wait |
first reading; Linux without schedstat; macOS |
previous is keyed by Identity, so a recycled pid never meets its predecessor's counters. What can still go
backwards is an exec on macOS (the new task keeps only the exec'ing thread's counters), or a counter that wraps.
restarted(ticks, runnable, system_ticks, previous) is true if the CPU, kernel-mode or runnable total decreased;
when it is, the rates that depend on those counters (system_share, syscall_io, major_faults, waiting) are
None for that one interval, and the high-water mark of waiting starts over. The I/O counters have their own
guard: IoBytes::rates uses checked_sub on the total and on each direction, returning None rather than a
negative or wrapped value. The test counter_resets_read_as_unknown_rates_not_negative pins this down.
The waiting estimate deserves its caveat. macOS updates a task's runnable time only when a thread is switched on
or blocks, so
The one place the model smooths is the CPU percentage, in measure:
let raw = ticks.saturating_sub(previous.ticks) as f32 / hz / dt * 100.0;
let alpha = smoothing(dt, 1.5);              // 1 - exp(-dt / 1.5)
process.cpu = previous.cpu + alpha * (raw - previous.cpu);
with smoothing(dt, tau) = 1 − exp(−dt/τ) in simulation.rs. Write raw,
A first-order low-pass (an RC circuit) obeys
So the code is not an approximation to the RC filter that happens to be cheap: for a held input it is the RC
filter, for any interval, regular or not. That is the reason the weight depends on dt. If the sampler is
paused for a minute, --sample-ms is changed the time constant does not.
Let the load step from 0 to 100 % at a sample instant. Then
| fraction | time after the step |
|---|---|
| 63.2 % | 1.50 s ( |
| 90 % | 3.45 s |
| 95 % | 4.49 s ( |
| 99 % | 6.91 s |
If the step falls inside an interval the first reading is partial and the output is slightly late: with the step a
fraction
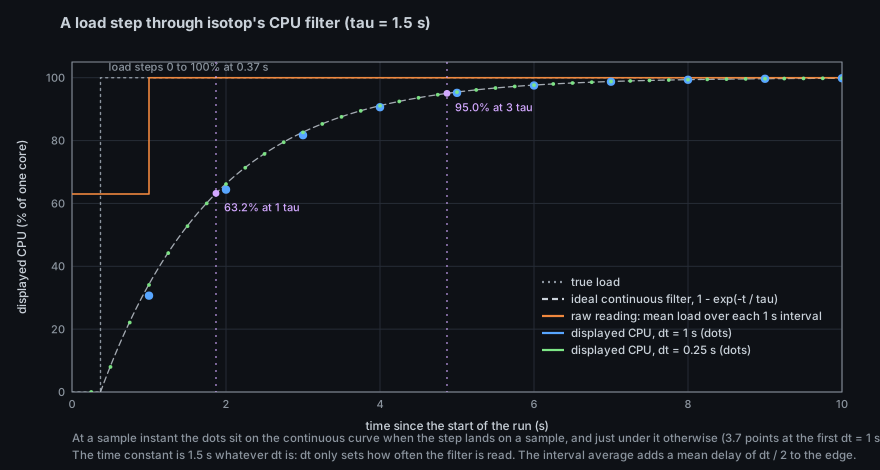
Two filters are in series: the interval average that differencing a counter implements (the mean load over the
last
using --sample-ms 1000).
In the frequency domain, from a continuous load at frequency
The exponential's
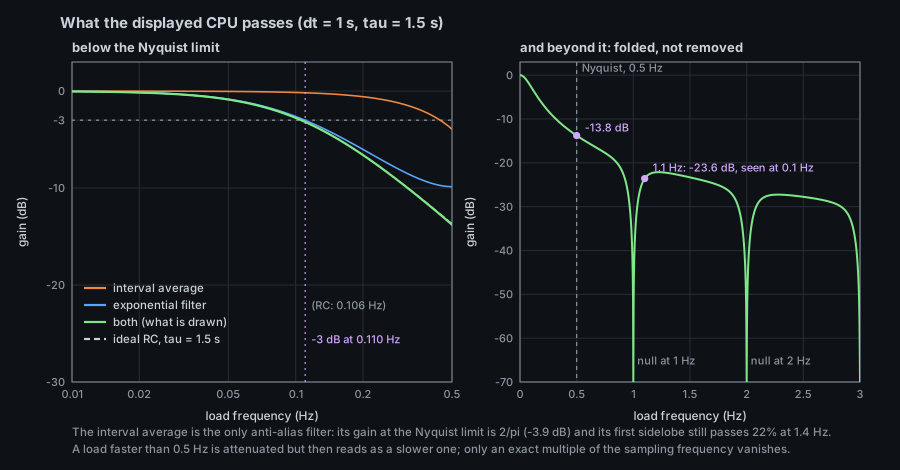
The smoother lives in the model, so every view that draws process.cpu is already filtered; the scene adds its own
visual easing on top, and History records the filtered values
(History).
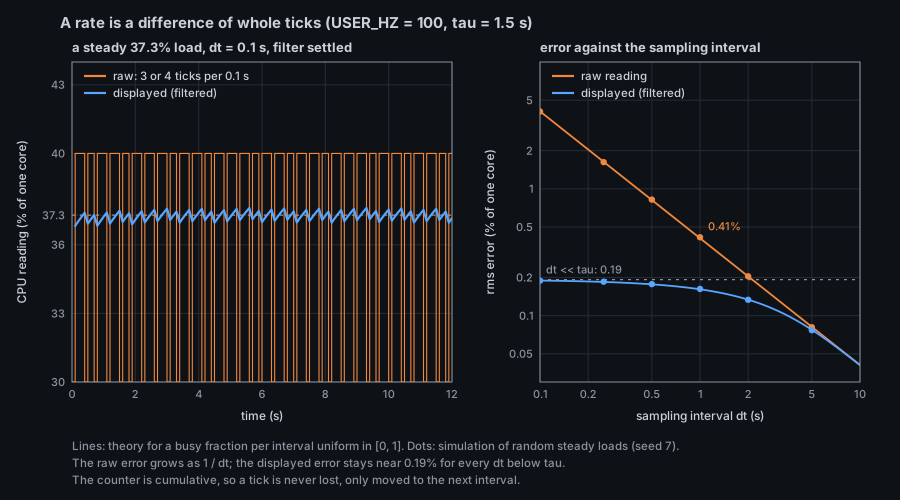
Two measurement effects sit under every CPU percentage, and neither is a bug. They are consequences of reading a counter.
On Linux the counter is in 10 ms ticks. Each reading
(0.41 % at
Because the counter is cumulative, the errors are
independent of the sampling interval. Sampling ten times faster makes each reading ten times noisier and the display no noisier at all; it only sees detail ten times finer. (Derived above and checked by simulation in the figure; the 1/6 assumes independent residues.)
A counter delta is an integrate-and-dump filter, and a poor anti-aliasing filter. Its gain,
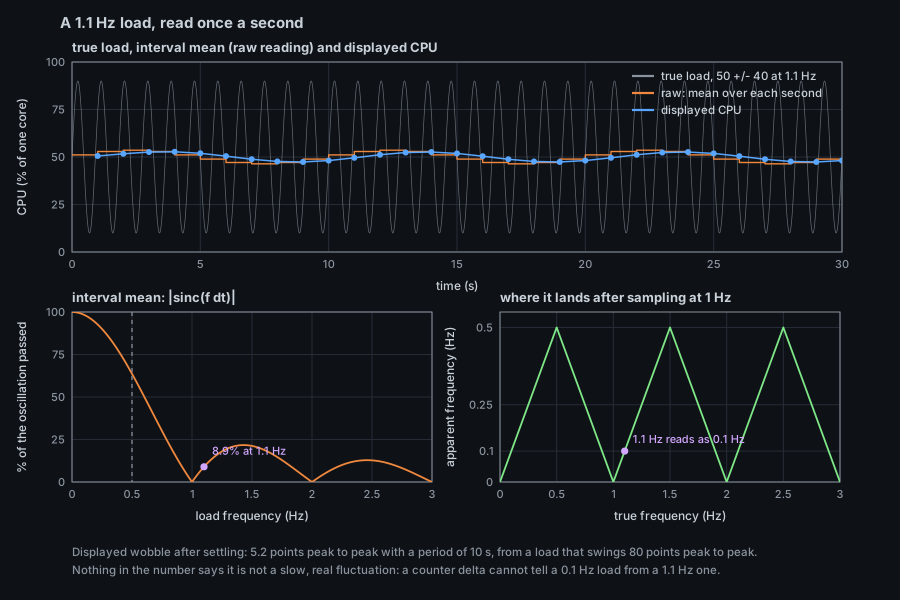
The same arithmetic applies to lifetimes: a process that lives less than the sampling interval is seen only with
probability
A reading that was not taken (the first sample of a rate, a counter that went backwards, an unreadable file) is
None in the model, not 0. A zero is a measurement ("this process read no bytes"); a missing number is the
absence of one, and the two draw different pictures. The contract:
- Platform samplers return
NoneorMeasured::Unreadablefor what they cannot read. - The model keeps
Nonethrough every derivation (the table above). - A view that has to draw something converts at its own boundary,
unwrap_or(0.0), only to draw what it always drew. The project counts those sites as debt (unwrap_or(0in the code report). - What a platform never has is a
SourceinSnapshot::missing, so views can say "no X" instead of drawing zeros.
Honest exceptions, all in the code as it stands: Process::cpu is an f32, 0.0 on a process's first sample (the
filter starts from zero, so the first few readings ramp up); the pressure percentages are 0 when a pressure file is
unreadable, with missing the only record; and on macOS the remote connections carry rtt, sent and received
of 0 as placeholders under Source::SocketTraffic.
top_n(processes, n, key) -> Vec<&Process> returns the n processes with the largest key, largest first. The
order is total and sample-independent: ties go to the smaller Identity, and a NaN key sorts after every number
(NaNs among themselves by Identity). Implementation: map to (key, process), select_nth_unstable_by to
partition so the best n are in front (expected $O(N)$), truncate, then sort just those Collector::sample picks the ROLLUP_PROCESSES (64) processes with the largest resident set for the
smaps_rollup reads, and threads::targets orders every process by CPU, busiest first, for the thread scan. The
scene's --limit admission is a separate mechanism.
describe(process) -> String is the one-line "what is this" used by labels, hover and the tour. Kernel threads are
matched by name prefix against a table of fourteen (kworker, ksoftirqd, migration, rcu, kswapd, irq/,
…); everything else against a table of 44 known programs (systemd-journal, sshd, pipewire, ghostty, …),
falling back to "app in your session", "container process" or "system service" by Kind. Matching is by prefix
because comm is truncated to 15 bytes, and the table lists the more specific entries first (pipewire-pulse
before pipewire, containerd-shim before containerd). It is lookup, not inference: a process named sshd that
is not the SSH server gets the same label.
--demo replaces the whole sampler with model::demo_with(time, count, options), a pure function of time: no
clock, no global state, so any time, in any order, including negative, gives the same snapshot.
DemoOptions::default() gives the workload every view has always had; a view asks for more on its registry row.
-
Base population. Process
$i$ has pid1000 + i,Identity::start = i + 1, a family of 16, and a kind fromfamily % 4. CPU isscale/16 · (1 + sin θ)^4 + bonuswithθ = 0.55 t + 1.71 i,scale = 20 + 24 (i mod 9)andbonus = 110for every 47th process. Memory, I/O, priorities, open files, deleted-but-open files and file locks are fixed functions of$i$ andtime. The demo does not pass throughmeasure, socpuhere is the raw formula, unsmoothed. -
Exact CPU time (
exact_cpu_time): the mean of$(1+\sin\theta)^4/16$ is$35/128$ , and the integral has a closed form. With$s = \sin\theta$ ,$(1+s)^4 = 1 + 4s + 6s^2 + 4s^3 + s^4$ , and$$\int (1+\sin\theta)^4,d\theta = \tfrac{35}{8}\theta - 8\cos\theta + \tfrac43\cos^3\theta - \tfrac74\sin 2\theta + \tfrac1{32}\sin 4\theta,$$ so CPU seconds$= \tfrac{\text{scale}}{16\cdot 0.55},[F(\theta(t)) - F(\theta(0))]/100 + \text{bonus}\cdot t/100 + 3.7,i$ , exactly the integral of the displayedcpu, never decreasing. Threads are then at least$\lceil\text{peak}/100\rceil$ so a single thread never exceeds one core. -
Churn (
churn): transient families (one per 16 base processes) on cycles of 24, 26, 28 or 30 s, staggered by5.9 · familys. A parent forks one to six children over two to four seconds, each child lives 3 to 12 s and exits (one in 16 withSIGTERM, one in 16 withSIGSEGV); some leave a zombie forDEMO_ZOMBIE_SECONDS = 1 s; once per 90 s one process leaks past 1 GiB and dies bySIGKILL. Pids come from a fixed pool and are reused with a newIdentity::start.demo_lifelists the forks and exits in(from, to],demo_eventsturns them into life events (forks "from the proc connector", exits "from taskstats" with an exit record), and a test pins that the events are exactly the difference of the two populations, so splitting an interval anywhere gives the same events. -
Options for the newer sources.
oom_and_memory_detailgives every process anOom(three System processes exempt) and the 64 largest a consistentRollup, one of them unreadable;kernel_counterssynthesizesinterrupts,softirqsandoom_kills(the sum of the demo units'oom_kills);threadsgives every process the threadsthreads::demo_listsynthesizes;channelssynthesizesunix_queuesandpipes. Plaindemoleaves them all unread. -
observersynthesises isotop's own row;mortalitystretches cycles to 84–105 s, adds shortshhelpers, a twelve-child compile burst, a stopped unit, a victim scope that counts its OOM kills and one exit in ten that only sample diffing sees. -
Clock.
DEMO_EPOCH = 1_791_605_520, 2026-10-10T04:12:00Z, is the wall time of demo time 0 (Snapshot::wall), so calendar-dependent views (the moon in the Necropolis) render the same everywhere. -
Determinism. The few random draws use
Rng, seeded fromhash_identity(Identity, salt)or a(family, epoch)pair, never from a global stream; salts separate unrelated uses of one identity. See Determinism. Inmain.rs,demo_snapshotwrapsdemo_withwith the shown view's options and, with churn, the events betweenpreviousandtime, so a live sample, a warm-up replay and a first sample all go through the same door.
- A CPU figure is the load of the last second or so, filtered, about 1.5 s late, quantised to a tick and aliased against anything periodic near the sampling frequency.
- A memory figure is a gauge read at the sample instant.
- "No number" and "zero" are different pictures: a missing rate is skipped or marked, an idle process is a measured zero.
- A demo frame is a function of
--time, not of the machine; a live frame is both.
-
model.rs:Identity,Process,Snapshot,Measured,Collector::sample,measure,restarted,IoBytes::rates,top_n,describe,demo_with,DemoOptions,demo_life,demo_events,DEMO_EPOCH,demo_cpu_integral. -
simulation.rs:smoothing,Rng,hash_identity. -
main.rs:demo_snapshot;src/interactive.rs: the sample clock inLive::sample. -
platform/mod.rs:RawProcess. - Figures:
docs/figures/model-smoothing-step.py,model-smoothing-response.py,model-quantised-counters.py,model-sampling-alias.py.
- A. V. Oppenheim and R. W. Schafer, Discrete-Time Signal Processing (Prentice Hall; several editions): sampling, aliasing, the exponential (one-pole) filter and its frequency response.
- C. E. Shannon, "Communication in the presence of noise", Proceedings of the IRE 37 (1949): the sampling theorem.
-
proc(5)andtime(7)for the units of the counters (Linux sampling).