Repository navigation
Metrics Trends Dashboard
Net-new Metrics & Trends dashboard for TestLink, added to the Reports menu.
TestLink 1.9.20 exposed a snapshot only: the Test Plan Metrics screen
(generalMetrics / metricsDashboard, modernized as
gui/templates/results/metricsDashboard.html) shows the current status of one
test plan and nothing rendered a longitudinal quality view across the plan's
builds. Issue #1073 ("Add Metrics & Trends dashboards for builds, releases and
defects") asks for exactly that trend view; this screen delivers the part that
maps onto the existing schema with no new tables. It is therefore a 2.0.1
enhancement rather than a legacy migration — nothing is dropped, because nothing
existed.

The dashboard answers three questions in one page:
- Where does the plan stand now? — a current-state snapshot (linked test cases, executed / not run / passed / failed / blocked, progress %, pass rate %, automation %, linked defects).
- Is quality improving? — a per-build trend (executions by status, progress %, pass rate %, Δ pass rate vs the previous build and linked defects), with the newest build flagged.
-
How much defect signal is there? — distinct defect references
(
execution_bugs.bug_id) attached to the filtered executions.
| Layer | File |
|---|---|
| Screen |
gui/templates/results/metricsTrends.html (Dashio standalone HTML/JS/CSS) |
| BFF |
api/metricstrends/index.php (GET|HEAD ?action=init|report) |
| Wiring |
cfg/reports.cfg.php metrics_trends + api/aside/index.php link_report_metrics_trends + $actions->metricsTrends
|
| i18n |
mt.* (61 keys) + footers.metricsTrends in all 10 client bundles; $TLS_link_report_metrics_trends in all 19 server locales |
| Method / route | Purpose | Notes |
|---|---|---|
GET|HEAD ?action=init&tplan_id=N[&tproject_id=P] |
context + filter options | returns context{tplan_id,tplan_name,tproject_id,tproject_name} and filters{builds[],platforms[]}
|
GET|HEAD ?action=report&tplan_id=N[&tproject_id=P][&build_id=B][&platform_id=PL] |
the aggregate | returns context, filters, filter{build_id,platform_id}, summary, build_trend[]
|
Error contract: 400 invalid_request, 401 not_authenticated /
session_expired, 403 no_right, 404 tplan_not_found / project_mismatch,
405 method_not_allowed.
A build_id / platform_id that does not belong to the owning test project is
refused with 400 invalid_request (never silently ignored — that would leak
counts from a foreign project).
- The unit is the test-case version linked to the test plan
(
testplan_tcversions.tcversion_id), counted once even when the plan links it on several platforms. -
summaryis the current known state: the latest recorded execution of a version (across all builds unless a build is filtered) supplies the reported status; a version with no execution is not run. This mirrors the "absolute latest execution" convention of the accepted siblingsapi/automationreportsandapi/defectintelligence. -
build_trendis the same latest-per-(version, build) status counted per build, ordered by build id (creation order), each row carryingnot_run,progress_pct,pass_rate_pct, adelta_pass_ratevs the previous build and anis_latestflag on the newest build. - Statuses map
p → passed,f → failed,b → blocked, anything else / no execution →not_run(byte-identical to the results family). -
defects=COUNT(DISTINCT execution_bugs.bug_id)over the filtered executions (bug_idis a varchar, so a distinct count — never a numeric sum).
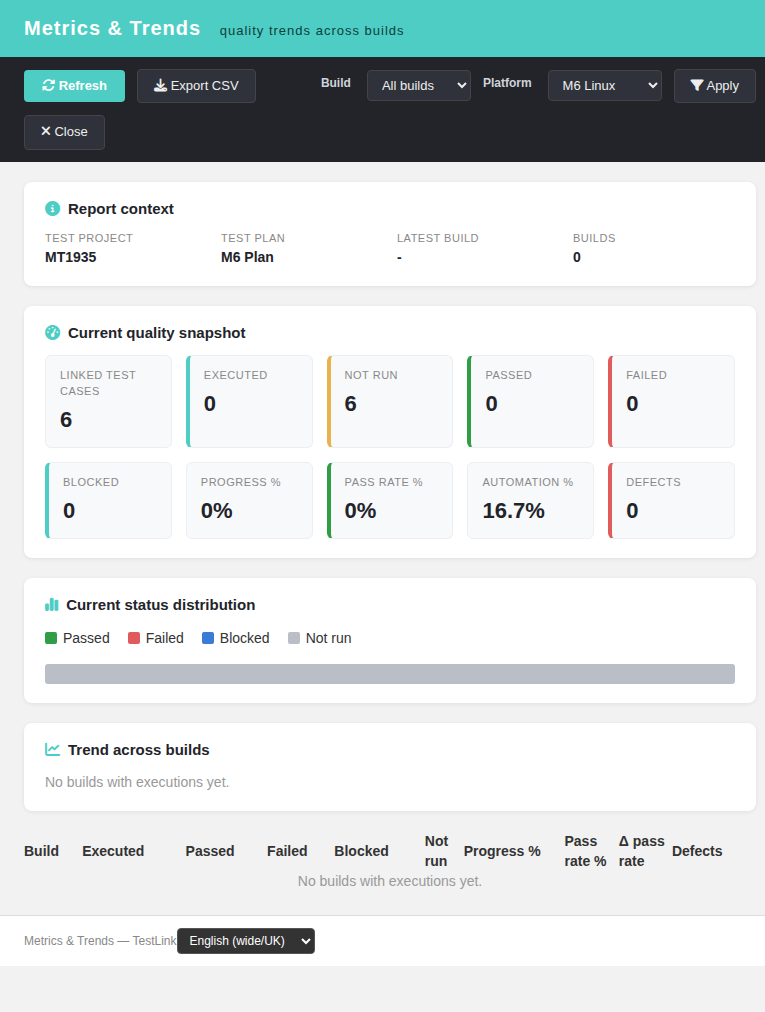
- Report context — test project, test plan, latest build, build count.
- Current quality snapshot — linked test cases, executed, not run, passed, failed, blocked, progress %, pass rate %, automation %, defects.
- Current status distribution — a compact CSS bar per status.
- Trend across builds — card strip (progress + delta) and a sortable DataTable (build, executed, passed, failed, blocked, not run, progress %, pass rate %, Δ pass rate, defects).
- Filters — build and platform (project-scoped).
-
Export CSV — the trend table (UTF-8 BOM,
;-separated, with a spreadsheet formula-injection guard).
- Refresh / Apply — re-run the report with the current filters.
- Export CSV — downloads the trend table; a Nothing to export toast when the trend is empty.
- Close — closes the window (same idiom as the sibling result screens).
-
Locale switcher — the standard
TLi18nswitcher; the whole page follows the selected bundle (English + Romanian + German + Spanish + French + Italian + Portuguese + Russian translated; Japanese + Chinese fall back to English, matching the rest of the results family). -
State cards — every BFF error code maps to a friendly title/body card, with
the raw server message shown as an escaped detail. The empty trend renders a
single full-width row and DataTables is not re-initialized on it (otherwise
the library aborts with
Incorrect column count, tn/18).


- Session auth (401 anonymous) +
bffSameOriginGuard()+bffEnforceSession(). -
testplan_metricschecked on the owning test project AND test plan withgetAccess = true(a right held only globally does not reach a private test project), mirroring the accepted siblingsapi/automationreports,api/keywordbarchart,api/qualitygate. - The plan is resolved first (opaque 404
tplan_not_found); the client'stproject_idis honoured only after the right check (project_mismatch). - Strict positive-integer readers for every id (
1abc,1.9,-3,''refused). -
html_entity_decode()on stored names; every BFF string is escaped client-side before it reaches the DOM; explicit$_GETreads (not$_REQUEST);Cache-Control: no-store.
Fixture tmp/fixtures_1935.php: project MT1935 (prefix M6), plan M6 Plan (2)
with 6 linked versions (1 automated), builds M6 Build 1/M6 Build 2, platform
M6 Linux (no executions), defects M6-BUG-1/M6-BUG-2, and a role-3 user for
the 403 path. Expected and measured (no filter): linked 6, executed 5, not run 1,
passed 4, failed 1, blocked 0, progress 83.3, pass rate 66.7, fail rate 16.7,
automation 16.7, defects 2; trend Build 1 → P2/F2/B1, pass 33.3; Build 2 →
P3/F1, pass 50.0, Δ +16.7, latest. Build filter → b1 only; platform filter (no
executions) → all not-run + empty trend; 400/401/403/404/405 matrix exact;
ai/verify_i18n_coverage.sh 9/9 PASS; browser render + build/platform Apply +
CSV export + Romanian locale + denied state verified; Event Viewer clean (0
ERROR/WARNING).