Repository navigation
Overall Metrics Pie Chart Modernized
Modernization of the Overall Metrics Pie Chart report
(lib/results/overallPieChart.php) — GitHub issue
#1907.
With every ASIDE entry already pointing at a modern screen
(docs/MODERNIZATION-STATUS.md: TODO = 0), a fresh sweep of the remaining legacy
lib/**/*.php controllers against api/ + gui/templates/**/*.html found the last
member of the orphan pChart PNG chart family without a dedicated modern twin.
platformPieChart.php (#1906), priorityBarChart.php (#1845),
keywordBarChart.php (#1906) and topLevelSuitesBarChart.php (#1905) already had
standalone report pages; the overall execution-status distribution was only drawn as
pixels by the modern Graphical Charts screen (charts_data → overall), with no
per-status DataTable, no totals row and no CSV export. This screen is now a standalone
Dashio page (gui/templates/results/overallPieChart.html) backed by a plain-PHP REST BFF
(api/overallpiechart/index.php), reachable from the Overall Metrics section of the
modern Graphical Charts report.

Path: Results → Graphical Charts → Overall Metrics →
Open Overall Metrics Pie Chart
URL: gui/templates/results/overallPieChart.html?tplan_id=N&tproject_id=P
BFF API: api/overallpiechart/index.php (GET|HEAD ?action=init&tplan_id=N[&tproject_id=P])
Legacy URL: lib/results/overallPieChart.php — now a launcher shim (302 / 405 / 400)
Auth: session (401 anonymous) + same-origin CSRF guard + the
testplan_metrics right on the owning test project (403 otherwise).
lib/results/overallPieChart.php never rendered a Smarty template. It included the
vendored pChart library (third_party/pchart) and answered a PNG pie chart of the
plan-wide execution-status distribution: one slice per status bucket (passed / failed /
blocked / not run / unknown), coloured via results.charts.status_colour and labelled via
results.status_label, over all builds + all platforms. Data came from the exact
helper the modern BFF reuses, tlTestPlanMetrics::getExecCountersByExecStatus() (latest
recorded execution per test-case version + platform wins; total includes not_run). A
plan with no builds answered a blank image (issue #634) — the modern screen shows a
localized Nothing to chart state instead.
The legacy gate was a global hasRight('testplan_metrics', ...) that never proved the
plan the numbers belonged to; tproject_id came raw from the session/$_REQUEST. The new
BFF:
- resolves the plan and derives the owning project server-side;
- checks
testplan_metricson that owning project and plan withgetAccess = true(a right held only globally no longer reaches a private project; an unknown plan is a plain404, as in the sibling BFFs); - treats
tproject_idas a client-side assertion (project_mismatch→ 404); - answers the full JSON contract:
400 invalid_request,401 not_authenticated / session_expired,403 no_right,404 tplan_not_found / project_mismatch,405 method_not_allowed, withnosniff+no-store.
gui/templates/results/overallPieChart.html follows the #1845/#1905/#1906 pattern:
Dashio shell, context strip (project, plan, executions, executed), a back-to-Charts link, a
single stacked distribution bar drawn in plain CSS + legend + the {executed} of {total} executed ({percent}%) caption, and a DataTable (Status / Quantity / Percentage
with a meter) with a bold Totals row. Refresh, Export CSV (RFC 4180 + UTF-8 BOM +
formula-injection neutralization), Close, and a footer locale switcher. Every label is
a bundle key (opc.*, footers.overallPieChart, charts.openOverallMetrics) in all ten
locales — the Română locale was translated.
Entry points: the charts.html Open Overall Metrics Pie Chart link, the
$actions->overallPieChart registration in lib/functions/common.php (inside the
tplan_id guard), and the legacy endpoint now being a session-guarded 302 shim
(document → redirect; XHR/<img> → 405 modern_endpoint_only; missing tplan_id → 400;
anonymous → login redirect preserving the destination).
Every label, the caption and the totals row render in English and Română (the locale
switcher drives TLi18n):

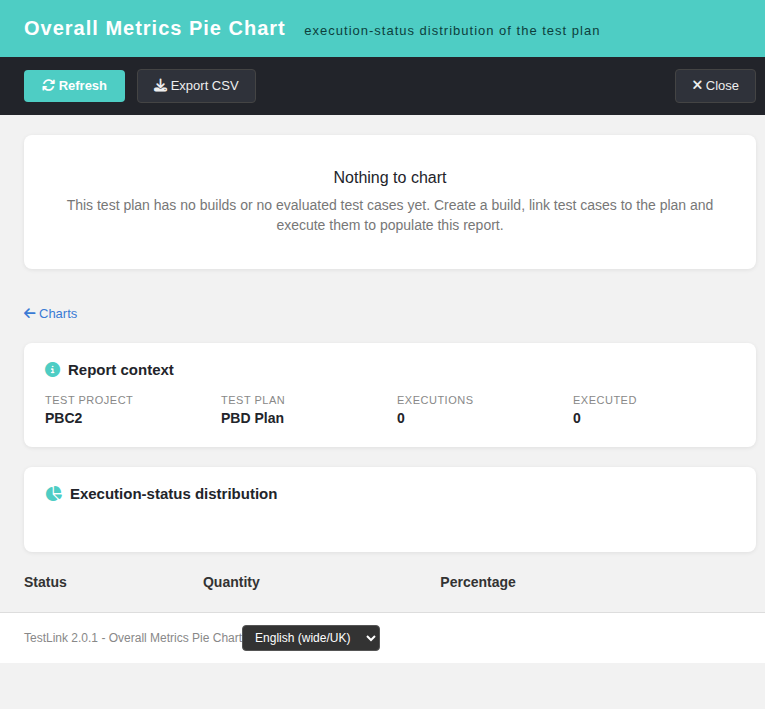
A plan without builds (legacy #634) or a build-less distribution (total 0) shows the localized Nothing to chart state with the context strip still rendered:
The Overall Metrics section of the Graphical Charts report gained the Open Overall Metrics Pie Chart link, beside the #1845/#1905/#1906 links:

One fresh-DB end-to-end suite was appended to tmp/TLU_Test_Cases.md
(## Task — Issue #1907). Built on tmp/fixtures_1845.php (project PBC1 / plan PBC, 6
assigned versions → passed 1 / failed 2 / blocked 1 / not run 2, total 6, executed 4) it
covers the chart render + DataTable + Totals, the latest-wins rule, the empty state
(build-less and zero-total plans), the CSV bytes (BOM + CRLF + localized labels + totals),
the Română locale, the no_right denial as a restricted role-3 user, the full BFF contract
matrix, the shim matrix and the charts.html entry link; ai/verify_i18n_coverage.sh is
9/9 PASS. events shows no unexpected Error/Warning rows (the single ERROR is the BFF's
own intended no_right audit denial exercised by the suite).