Repository navigation
Style Chord
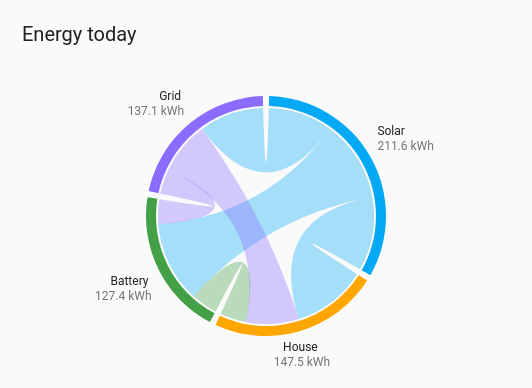
Flows between a handful of places, drawn round a circle. Each node is an arc as long as everything flowing into and out of it, and each flow is a ribbon joining its two nodes, as wide as the flow at both ends. Unlike a Sankey, flows can go both ways between two nodes and round in a loop, so energy that goes from the grid into the battery and back out to the grid fits on one chart. It draws the current values, so no history is loaded.
Exchanges between a few places: energy between solar, battery, grid and house; people moving between rooms; water between tanks.
type: custom:chartdeck-card
style: chord
title: Energy today
unit: kWh
entities:
  - entity: sensor.solar_to_house_energy
    from: Solar
    to: House
  - entity: sensor.solar_to_battery_energy
    from: Solar
    to: Battery
  - entity: sensor.battery_to_house_energy
    from: Battery
    to: House
  - entity: sensor.grid_to_house_energy
    from: Grid
    to: House
  - entity: sensor.grid_to_battery_energy
    from: Grid
    to: Battery
  - entity: sensor.battery_to_grid_energy
    from: Battery
    to: Grid
To use this style, set style: chord (or pick Chord (flows round a circle) under Parts of a total in the editor's Style section). Each entity's Flows from and Flows to are in its own options, the same fields as on the Sankey, so a card can switch between the two and keep its flows. The chart options are in the editor's Chart section.
- Nodes go round the circle in the order they first appear in the list, clockwise from the top, with a small gap between them. Each arc's length is everything flowing in and out of that node.
- Ribbons join the two nodes of a flow. Each end is as wide as the flow, so a ribbon has the same width at both ends.
- Ribbon ends on a node are stacked by how far round the circle the other node is, so ribbons don't cross where they need not. Where a node sends to and receives from the same node, what it sends comes first.
- Labels sit outside the middle of each arc: the node's name and its total, cut short with "…" past a quarter of the card's width. The circle grows with the card, up to 240 px across.
- Nothing flowing counts as nothing: an unavailable, negative or non-number reading is a flow of 0, and a flow of 0 isn't drawn. When nothing at all flows the card says "Nothing is flowing right now."
pad: 3                 # degrees between nodes, 0 to 20 (default 3)
ribbon_opacity: 0.5    # above 0, up to 1; default 0.35 (0.45 in a dark theme)
sort: descending       # none (default), ascending or descending: orders the nodes by total
entities:
  - entity: sensor.solar_to_house_energy
    from: Solar        # the node this flow leaves
    to: House          # the node it arrives at
color: amber # this ribbon's colour- Nodes take the series colours in order of first appearance. A ribbon takes the colour of the node it leaves, unless the flow has its own
color. -
sort(the card's Sort option in Display) puts the nodes round the circle by their total, smallest or biggest first. - The gaps between nodes never take up more than half the circle, whatever
padsays. -
show.name: falseandshow.value: falseleave the node names or totals out of the labels. - Flows need both a
fromand ato. Entities without both are left out; with none at all the card says "Give each entity a "Flows from" and a "Flows to" in its options."fromandtomust be different nodes. - The totals use the first flow's unit and decimals.
Hovering or touching a ribbon lights it, fades the others and shows "Solar → House" with its value. Hovering a node lights every ribbon that touches it. Tapping a ribbon runs that entity's tap action (more-info by default).
In the editor: Gap between nodes and Ribbon opacity in the Chart section. Each entity has Flows from, Flows to and Flow colour.
Layout: one chart for the whole card. Every shared option is described on the Options page.
Previous: Marimekko · Next: Battery grid · All styles