Repository navigation
Style Spiral
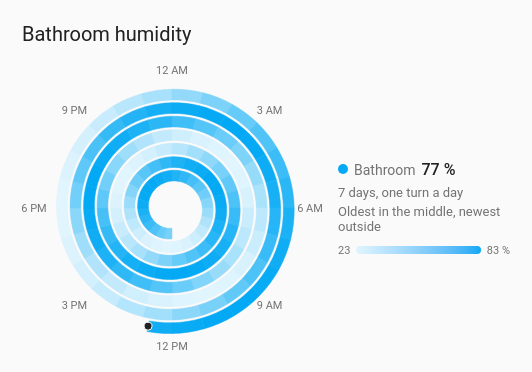
A history chart wound into a spiral, one turn per day (or per week). Midnight is at the top of every turn, the oldest day is in the middle and today is on the outside, and each hour is a stretch of the ring shaded by its value. A habit that repeats every day, like the evening peak or the morning shower, lines up along one direction, and a day that broke the pattern stands out.
Daily or weekly routines over several days or weeks: power, humidity, heating, a room's occupancy.
type: custom:chartdeck-card
style: spiral
title: Bathroom humidity
entities:
  - entity: sensor.bathroom_humidity
    name: Bathroom
To use this style, set style: spiral (or pick Spiral under History charts in the editor's Style section). The chart options are in the editor's Chart section.
-
One turn per day, 7 turns: the last 7 days, ending now. With
turn: weekthe default is 4 turns. -
One stretch per hour: readings are grouped by hour in Home Assistant's time zone (
aggregate: mean, the default, averages them). A day with a clock change is still exactly one turn. - Colour is a smooth scale of the entity's colour, faint for the lowest hour in view and full for the highest, as on the heatmap.
- A faint track shows the whole span under the coloured stretches, so hours with no readings read as gaps, not as zero. A dot marks now, when the span reaches it.
turn: day          # day (default) or week: what one turn of the spiral covers
turns: 7           # 1 to 31 days, or 1 to 13 weeks; default 7 days or 4 weeks
ring_width: 80     # how much of the space between turns each ring fills, 20 to 100 % (default 80)
color_by: scale    # scale (default) or bands
color_min: 0       # the value the faintest colour stands for
color_max: 100     # the value the fullest colour stands for
legend: true       # the scale beside or under the spiral (default true)
tooltip: true      # hover readout (default true)
aggregate: mean    # how each hour is combined: mean (default), sum, min, max, first, last or change
source: history    # history (default) or statistics
period:
  offset: 1        # the same span this many spans back
navigate: true # previous and next buttons-
turnssets the span:turns: 14is the last 14 days. The period'slast,unit,calendaranduntilare not used here;offsetandnavigateare. -
aggregate: changesuits meters: each hour shows how much the meter rose. -
color_by: bandsshades each hour by the entity's colour bands instead of the scale, and the legend lists the bands. -
color_min/color_maxfix the ends of the scale; the first must be below the second. - Per entity,
colorsets the colour of its scale.
Each entity gets its own spiral and legend. The legend sits beside the spiral on a wide card and under it on a narrow one, with the entity's name and value, what the span is ("7 days, one turn a day") and the scale. Hovering or touching a stretch shows its day, hour and value. Tapping the spiral or the name runs the entity's tap action.
In the editor: One turn per, Turns, Periods back, the previous and next buttons, Readings from, Combine with, Colour, Ring width, Lowest colour at, Highest colour at, Legend and the hover switch. Each entity has a Line colour.
Unavailable and missing entities draw an empty track. The spiral fades in, without motion when the browser asks for less.
The source and the previous and next buttons work as on the line chart. See Line.
Layout: one chart for the whole card. Every shared option is described on the Options page.
Previous: Battery grid · Next: Strip plot · All styles