Repository navigation
Style Cycle Plot
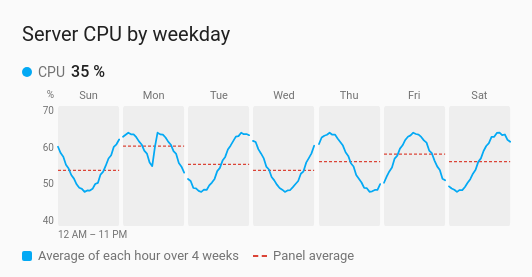
One small panel per part of a cycle, side by side on one value scale. With the default cycle there is a panel per day of the week, each holding the average day for that weekday over the last few weeks, with a dashed line at the panel's average. A pattern that a single long line hides, such as Monday mornings running higher than the rest of the week, shows up as one panel standing out.
Weekly routines: house power, heating, a server's load, people in an office. Or how one hour of the day, or one day of the month, drifts over time.
type: custom:chartdeck-card
style: cycle_plot
title: Server CPU by weekday
weeks: 4
entities:
  - entity: sensor.server_cpu
    name: CPU
To use this style, set style: cycle_plot (or pick Cycle plot under History charts in the editor's Style section). The chart options are in the editor's Chart section.
cycle |
Panels | Each panel's line | Default span | Longest span |
|---|---|---|---|---|
day_of_week (default) |
One per weekday, from your first weekday | That weekday's average for each hour of the day | 8 weeks | 26 weeks |
hour_of_day |
One per hour, 24 in all, wrapping onto rows | That hour on each day of the span, in turn | 2 weeks | 13 weeks |
day_of_month |
One per day of the month, 31 in all | That day in each month of the span, in turn | 26 weeks | 104 weeks |
day_of_week and hour_of_day read the readings an hour at a time; day_of_month reads them a day at a time, from long-term statistics by default, since history rarely reaches back months.
cycle: day_of_week   # day_of_week (default), hour_of_day or day_of_month
weeks: 8             # the span in weeks; the default and the most allowed depend on the cycle
aggregate: mean      # how each hour (or day) is combined: mean (default), sum, min, max, first, last or change
source: history      # history, or statistics; default statistics for day_of_month
tooltip: true
period:
  offset: 1          # the same span this many spans back
navigate: true # previous and next buttons-
weeksis the span for every cycle, so a year of days of the month isweeks: 52. -
aggregate: changesuits meters: each hour (or day) shows how much the meter rose. - The period's
last,unit,calendaranduntilare not used here;offsetandnavigateare. - All panels share one value scale, labelled down the left of each row.
- With one entity, the panel average is dashed in red. With several, each entity has its own line and its own dashed average, in its colour.
- Under the first panel, a note says what each line runs across ("12 AM – 11 PM", or the dates or months of the span). A legend under the panels says what the line and the dashed line are.
- Per entity,
colorsets its line's colour.
Hovering or touching a panel shows the moment under the pointer ("Sunday 8:00 AM – 9:00 AM"), each entity's value there and that panel's average, with a guide line. Tapping a name in the header or the legend runs the entity's tap action.
In the editor: One panel per, Weeks, Periods back, the previous and next buttons, Readings from, Combine with and the hover switch. Each entity has a Line colour.
The source and the previous and next buttons work as on the line chart. See Line. Lines fade in, without motion when the browser asks for less.
Layout: one chart for the whole card. Every shared option is described on the Options page.
Previous: Strip plot · All styles