Repository navigation
Style Strip Plot
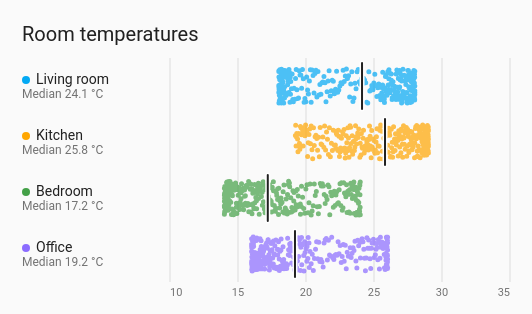
Every reading as a dot along a value axis, one row per entity, spread across the row so dense spells show as a thick band. A line across each row marks the median (or the average). It shows the spread and the clusters without the smoothing of a violin, and handles far more readings than a beeswarm, whose dots are packed so none overlap.
How readings are spread, compared between a few entities: room temperatures, humidity, power, over a day or a week.
type: custom:chartdeck-card
style: strip_plot
title: Room temperatures
entities:
  - entity: sensor.living_room_temperature
    name: Living room
  - entity: sensor.kitchen_temperature
    name: Kitchen
  - entity: sensor.bedroom_temperature
    name: Bedroom
  - entity: sensor.office_temperature
    name: Office
To use this style, set style: strip_plot (or pick Strip plot under Distributions in the editor's Style section). The chart options are in the editor's Chart section.
- One dot per reading taken in the period. The value carried in from before the period, and the copy carried to its right edge, are not readings and get no dot.
- Spread: dots are scattered over 70 % of the row's height. A dot's place across the row comes from its own time, so it stays put as new readings arrive and old ones drop off: the plot doesn't shimmer when it redraws.
- 5 px dots, a little see-through, so overlaps read darker.
- At most 2000 dots per row: more are sampled evenly, and the row still says how many readings there were.
- Marker: a line at the median of the readings, with the value under the entity's name ("Median 21.4 °C").
-
Period: the last 24 hours when
periodisn't set.
marker: median           # median (default), mean or none
jitter: 70               # how much of the row the dots spread over, 0 to 100 % (default 70)
dot_size: 5              # 2 to 16 px (default 5)
orientation: horizontal  # horizontal (default) or vertical
value_axis: true
value_grid: true
value_min: 15            # fixed ends of the value axis
value_max: 25
compact: false
tooltip: true-
marker: meandraws the line at the plain average and writes "Average …" under the name;marker: nonedraws no line and writes the number of readings instead. - The median and average are of the readings as taken, not weighted by time, so the line sits among the dots it sums up.
-
jitter: 0puts every dot on the row's centre line. - Per entity,
colorsets the dots' colour.
Hovering or touching a row shows how many readings it has (and how many dots are shown, when it was sampled), the median, the average, the middle half, and the lowest and highest.
In the editor: the period and source, Line across each row at, Spread across the row, Dot size (px), Direction, Value labels, Lines at each value label, Lowest value shown, Highest value shown, the hover switch and Compact. Each entity has a Colour.
The period, calendar spans, previous and next buttons, source and grouping are the same as on the line chart. See Line.
Layout: one chart for the whole card. Every shared option is described on the Options page.
Previous: Spiral · Next: Cycle plot · All styles