Repository navigation
Style Marimekko
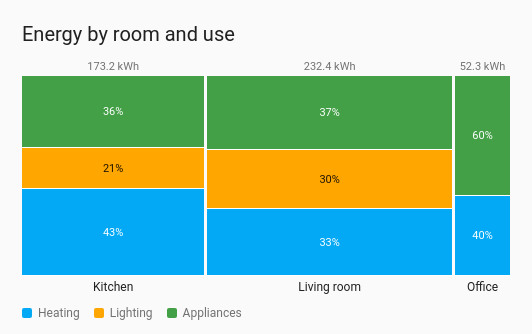
A total split two ways at once. Each group is a column as wide as its share of the whole, and each column is split into its categories, stacked by their share of that column. The living room's column is the widest because it used the most, and within it you can see how much went on heating. It draws from the entities' current values, so no history is involved.
A total that splits by two things, such as energy by room and by use, or water by floor and by tap, where a treemap or pie would only show one split.
type: custom:chartdeck-card
style: marimekko
title: Energy by room and use
unit: kWh
entities:
  - entity: sensor.kitchen_heating_energy
    group: Kitchen
    category: Heating
  - entity: sensor.kitchen_lighting_energy
    group: Kitchen
    category: Lighting
  - entity: sensor.kitchen_appliance_energy
    group: Kitchen
    category: Appliances
  - entity: sensor.living_room_heating_energy
    group: Living room
    category: Heating
  - entity: sensor.living_room_lighting_energy
    group: Living room
    category: Lighting
  - entity: sensor.office_heating_energy
    group: Office
    category: Heating
To use this style, set style: marimekko (or pick Marimekko under Parts of a total in the editor's Style section). The chart option is in the editor's Chart section; each entity's Column (group), Category and Category colour are in its own options.
-
Columns are the groups. An entity's own
groupnames its column. Without one, the card'sgroup_byplaces it by floor, area, device or label from Home Assistant's registries, as on the treemap; several levels are joined with " / ". An entity with neither goes in Other. - Column width is the group's share of the total of every entity.
-
Segments are the entities, each as tall as its share of its column. An entity's
categorysets its colour; without one, its name is its category. - Categories stack in the order they are listed, bottom up, in the same order in every column, so a colour sits at the same place across the chart however the values move.
- Above each column is its total (when every entity shares a unit), and below it is the group's name. A legend of the categories sits under the chart when there are two or more.
segment_labels: percent  # percent (default), value, both or none
sort: descending         # none (default), ascending or descending: orders the columns by total
group_by: [floor, area]  # any of floor, area, device, label, for entities without their own group
entities:
  - entity: sensor.kitchen_heating_energy
    group: Kitchen       # this entity's column
    category: Heating    # this entity's colour in the legend
color: red # the category's colour-
segment_labelsis the text printed inside each segment: its share of the column, its value, both, or nothing. Text is printed only where it fits: segments under 18 px tall, or too narrow for the text, stay blank.bothfalls back to the share when both don't fit. -
sort(the card's Sort option in Display) orders the columns by their total, smallest or biggest first. Segments inside a column keep the category order. - A category takes the first own
coloramong its entities, otherwise the next series colour. -
show.value: falsehides the totals above the columns;show.name: falsehides the group names under them.
In the editor: Text on each part and Group by in the Chart section. Each entity has Column (group), Category and Category colour.
Entities with no reading (unavailable or not found) are listed under the chart after No reading:, still tappable. Zero and negative values get no segment, and a group with nothing above zero gets no column. With nothing above zero at all the card says so.
Segments are the entities' own elements, so tap_action, hold_action and double_tap_action work as on the other styles (more-info by default). Hovering a segment shows its column, category, value and share.
Segments are placed in percentages, so the chart follows the card's width without being drawn again.
Layout: one chart for the whole card. Every shared option is described on the Options page.
Previous: Trend · Next: Chord · All styles