Repository navigation
Test Execution Duration Report Modernized
Tracking issue: #1975 (parent metric: #1073, Metrics & Trends — average test execution duration / execution rate).
A net-new TestLink 2.0.1 report under Reports. TestLink 1.9.20 stores the
actual duration of every execution in executions.execution_duration
(minutes, decimal(6,2)) but ships no screen that reports it: the execution
history of a test case shows one run at a time, and every 1.9.20 report
aggregates status only. As a result a team could not answer:
- how long execution takes for a plan,
- which test cases are the slowest,
- how many executions per day were recorded.
This screen answers those questions for a rolling window.
gui/templates/results/execDuration.html
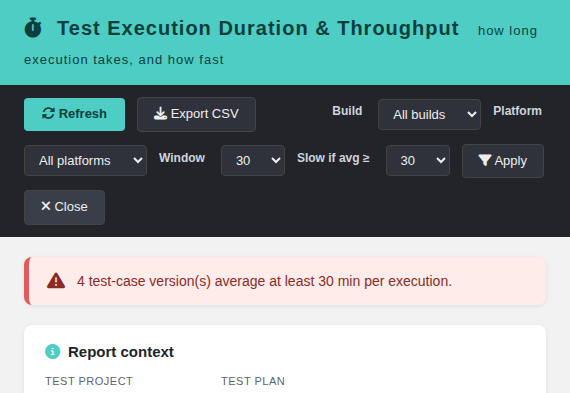
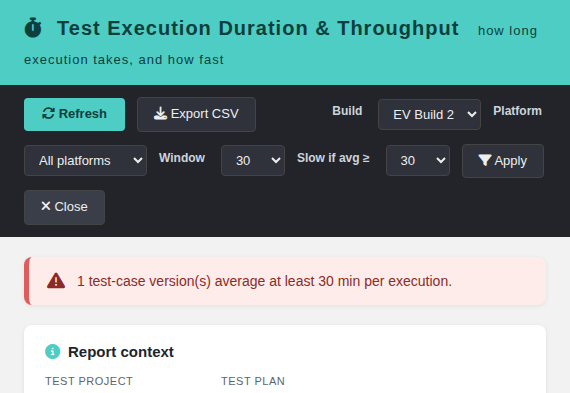
- Dashio teal header, dark toolbar (Refresh, Export CSV, Build, Platform, Window, Slow threshold, Apply, Close).
- Report-context panel (project, plan, build, platform, window, threshold).
- 10 KPI cards: executions, executions with duration, duration coverage %, average, median, P90, total minutes, throughput per day, slow versions, distinct testers.
- Verdict banner (no executions / slow versions / all normal / no duration recorded).
- Per-build breakdown table (executions, timed executions, total and average minutes).
- Main 13-column DataTable, slowest average first: test case, external id, suite, verdict, executions, with duration, avg/min/max/total minutes, last status, last run, builds.
- CSV export (BOM + spreadsheet-formula neutralisation).
- Localized state cards for 400 / 401 / 403 / 404 / 405.
api/execduration/index.php — plain PHP, session auth, bffSameOriginGuard,
bffEnforceSession, JSON I/O, Cache-Control: no-store.
| Action | Method | Parameters |
|---|---|---|
init |
GET|HEAD |
tplan_id, optional tproject_id
|
report |
GET|HEAD |
tplan_id, optional tproject_id, build_id, platform_id, window_days (1–365, default 30), slow_min (1–1440, default 30) |
Rights: testplan_metrics on the owning test project of the plan
(getAccess = true). The client-supplied tproject_id is only an assertion and
can never widen the query.
Error contract: not_authenticated (401), no_right (403),
tplan_not_found / project_mismatch (404), invalid_request /
method_not_allowed (400/405).
- The analysed window is the last
window_daysdays ending now; only executions with anexecution_tsinside the window are counted, so the throughput figure is meaningful. -
execution_durationis the actual duration in minutes. ANULLor0duration means "not recorded" and is excluded from the duration maths but still counts for throughput and status distribution. - The unit of the table is the test-case version (
tcversion_id); only versions currently linked to the plan (testplan_tcversions) are considered, so an execution that survives an un-assignment cannot resurrect a version. - A version is slow when its average recorded duration is at least
slow_minminutes.
-
cfg/reports.cfg.php:$tlCfg->reports_list['exec_duration']. -
api/aside/index.php: Reports menu mapping forlink_report_exec_duration. -
api/resultsnav/index.php:exec_duration→ modern screen. -
lib/functions/common.php:$actions->execDuration. -
locale/*/strings.txt:$TLS_link_report_exec_duration(19 server locales). - i18n:
execDuration.*keys +footers.execDurationin all 10 bundles.
- Fixture:
tmp/fixtures_1953.php(plan 4) with execution durations seeded via SQL (execution_duration = id * 15,execution_ts = NOW() - id days). - BFF: init 200; report 200 with 7 executions / 420 min / avg 60 / median 60 / P90 105; build filter narrows to 1 execution; no session 401; unknown plan 404; project mismatch 404; invalid window 400; no-right user 403.
- Browser (admin, EN): report renders, filters apply, CSV button enables, console clean, no raw i18n keys.
- i18n coverage gate: 9/9 bundles PASS (10228 keys).
- Suite:
Issue #1975intmp/TLU_Test_Cases.md= 12/12 PASS.