Repository navigation
Log Aggregation and Visibility Guide
Source and visual review: November 17, 2026. No source logs read, services configured, packets sent, listeners started or SIEM rules executed. Examples require version-specific validation and an approved deployment plan.
Centralized logging reference for wireless sensors, DHCP, RADIUS/NAC, switches, firewalls, DNS, rsyslog and selected SIEM integration points.
Twelve parts cover architecture, source collection, rsyslog receiving, SIEM adapters, verification, troubleshooting and security. Examples illustrate selected rsyslog, Windows and product-specific integration points; this is not a complete syslog-ng, Windows Event Forwarding or cloud-logging deployment. Paths, parsers, permissions and transport settings require validation for the selected release.
Build a documented collection and investigation pipeline with known source coverage, parsing, time and retention limits. Centralization supports correlation but does not guarantee complete visibility or automatic incident detection.
- Setting up a new homelab SIEM or IR environment from scratch
- Adding a new device type (pfSense, Windows DC, Apache) to an existing log pipeline
- Troubleshooting missing log sources when an incident reveals a visibility gap
- Validating end-to-end log flow before declaring IR readiness
Effective incident response begins long before an incident occurs. This guide covers establishing the logging infrastructure and visibility required to detect, investigate, and respond to security events. Without proper log aggregation, you're flying blind.
This guide focuses on configuring critical log sources to feed into your SIEM (Wazuh, ELK Stack, Splunk, or similar).
| Without Centralized Logging | With Centralized Logging |
|---|---|
| Logs scattered across devices | Search across the sources actually collected |
| Manual correlation required | Correlation rules can be built and tested |
| Evidence lost due to rotation | Configured retention and recoverability |
| Attackers can clear local logs | Separate storage can reduce shared failure; integrity needs its own controls |
| Reactive incident discovery | Detection opportunities if relevant events and rules exist |
| Source | Log Type | What We're Looking For |
|---|---|---|
| Wireless sensor / WIDS (for example Kismet) | Version-specific alerts and radio records | Candidate BSSID/SSID/channel changes; document radio and channel coverage. Zeek adds protocol context only where its capture path has visibility. |
| DHCP Server | Actual server lease/audit records | Time-bounded address assignment; client-supplied names are not authenticated identities. |
| RADIUS / NAC | Product authentication/accounting records | Access result and policy, correlated identity and endpoint; not automatic proof of MAC spoofing. |
| Network Switches | SNMP / Syslog | Port status changes; Port security violations; Unknown MACs |
| Firewalls | traffic / threat | Denied connections; IPS alerts; Geo-anomalies |
| DNS Servers | query logs | Unusual queries; Known-bad domains; High-entropy names (DGA) |
| Active Directory | Security Event Log | Authentication events; Group changes; Privilege escalation |
| Endpoints (Sysmon) | Sysmon Operational | Process creation; Network connections; File/Registry changes |
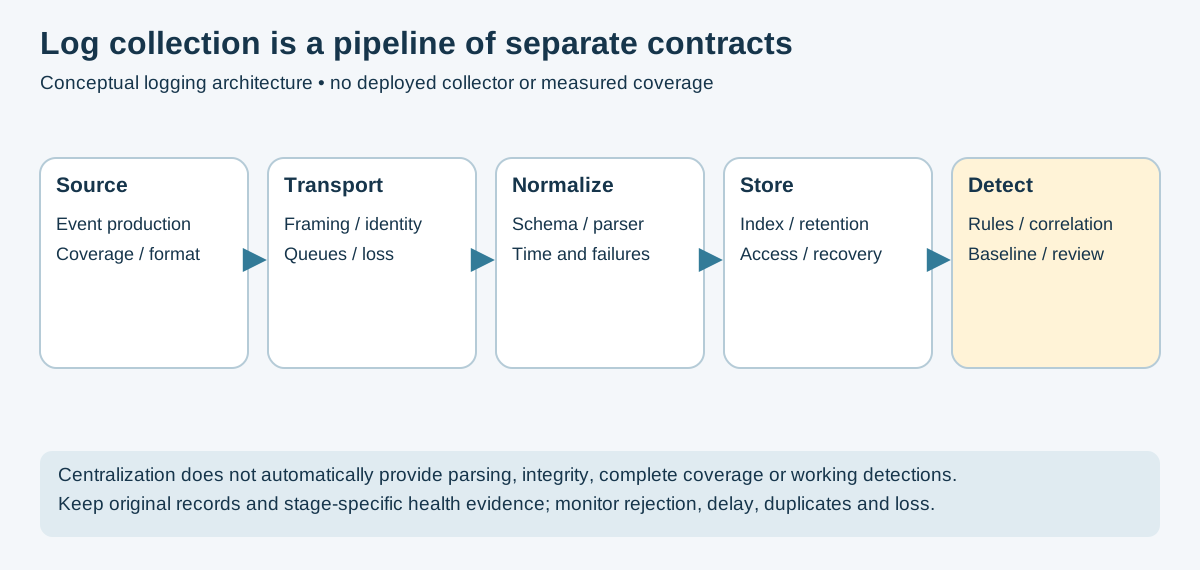
Figure 1 — Original conceptual pipeline; no product configuration is implied. Compare rsyslog input/ruleset/action guidance and Elastic schema documentation.
┌─────────────────┐     ┌─────────────────┐     ┌─────────────────┐
│   Log Sources   │────▶│   Aggregation   │────▶│      SIEM       │
│                 │     │     Layer       │     │                 │
│ • Switches      │     │                 │     │ • Wazuh         │
│ • Firewalls     │     │ • Rsyslog       │     │ • ELK Stack     │
│ • DHCP/DNS      │     │ • Logstash      │     │ • Splunk        │
│ • Wireless IDS  │     │ • Filebeat      │     │ • Graylog       │
│ • Endpoints     │     │ • Fluentd       │     │                 │
└─────────────────┘     └─────────────────┘     └─────────────────┘
| Component | Recommended Placement |
|---|---|
| SIEM Server | Management VLAN, isolated segment |
| Log Collectors | Each network segment/site |
| Listening Stations | Strategic locations (wireless coverage) |
These are common defaults, not a firewall policy or proof a listener exists. Verify transport, bind address and selected configuration. The product receiver examples below are alternatives: do not bind several daemons to the same address/port.
| Protocol | Port | Purpose |
|---|---|---|
| Syslog (UDP) | 514 | Traditional syslog |
| Syslog (TCP) | Commonly 514 | Ordered transport; not by itself durable delivery, encryption or identity verification |
| Syslog (TLS) | Commonly 6514 | Encryption and configured peer verification; the port alone does not enable TLS |
| Beats | 5044 | Filebeat/Winlogbeat to Logstash |
| Wazuh Agent | Typically 1514/TCP | Agent protocol; distinct from the optional syslog listener |
| SNMP Traps | 162 | Network device alerts |
Kismet provides passive wireless monitoring to detect rogue access points, deauthentication attacks, and unauthorized devices.
A Raspberry Pi running Kismet positioned to monitor your wireless environment, forwarding alerts to your SIEM.
| Component | Specification |
|---|---|
| Device | Raspberry Pi 4 (2GB+ RAM) |
| WiFi Adapter | Monitor mode capable (Alfa AWUS036ACH recommended) |
| Storage | 32GB+ SD card |
| Power | PoE HAT or standard power supply |
Use Kismet's current installation guidance for the exact OS, architecture and repository. Do not construct a repository URL from a codename that may not be supported. Group membership and packet-capture privileges require a deliberate access review.
Identify the actual capture interface and supported log types from the installed release. Use a local override configuration rather than replacing packaged defaults. Record the sensor, channel plan, hopping gaps, time source and retention policy. A monitor-mode claim does not guarantee adapter/driver compatibility.
Choose a documented database/export, API or event-integration path. A Kismet
database is not syslog text. The former alertsyslog and bare alert-directive
examples were not verified for a current build and are not a supported recipe.
Preserve original alert records and map fields explicitly.
Feed only the validated export into a scoped collector input. Select framing,
parser and transport for that representation; a local5 facility is a site choice,
not a Kismet identity guarantee. Confirm delivery and parser behavior with fixtures.
Inspect the package's service unit and runtime-user model before adding a custom
unit. Do not overwrite the packaged unit or assume User=kismet exists. Validate
paths, config, privileges, writable directories and service behavior in the lab.
Primary reference: Kismet logging.
| Alert | Indication |
|---|---|
| Spoof/baseline alert supported by the build | Candidate inventory mismatch; corroborate with controller and endpoint records |
DEAUTHFLOOD when supported |
Management-frame rate anomaly, not automatic actor intent |
| Timestamp anomaly | Possible clock/reset/spoofing behavior requiring investigation |
| Channel change | Could be authorized channel selection or an anomaly |
| Ad-hoc conflict alert when supported | Compare actual alert definition, baseline and capture quality |
DHCP logs show server-observed lease activity. Static addresses, IPv6 methods, missing logs and spoofed/client-supplied identifiers limit coverage and attribution.
Historical ISC DHCP: upstream maintenance ended in 2022; use this only when
maintaining an existing deployment and plan migration. log-facility local7;
selects a facility; it does not turn on a universal verbose mode. Do not add or
change subnet pools merely to enable logging. See ISC status.
Route the actual server's events to an approved local file or collector. Facilities can collide across programs; use source/application metadata and retain originals. Choose the authenticated forwarding design in Part 12 rather than a wildcard UDP destination. Validate before a separately planned service reload or restart.
# Enable audit logging via PowerShell
Set-DhcpServerAuditLog -Enable $true -Path "C:\Windows\System32\dhcp"

# Or via DHCP Management Console:
# Right-click server → Properties → General → Enable DHCP audit loggingSelect the configured audit-file path or the relevant supported Windows Event
channels. DHCP audit text has a structured record format; declaring
log_format=syslog in an agent does not prove correct field extraction.
Build and test a decoder with sample records, including headers and rotation.
Use Microsoft's audit-log settings
and Wazuh localfile documentation.
The former unauthenticated NXLog UDP example is not a production deployment.
The following strings can be low-confidence inventory clues only. They neither identify an OS reliably nor establish malicious intent. Apply baseline exceptions and correlate authorized labs, DHCP/NAC and endpoint evidence.
| Pattern | Indication |
|---|---|
kali* |
Kali Linux |
parrot* |
Parrot Security OS |
blackarch* |
BlackArch Linux |
pentoo* |
Pentoo Linux |
commando* |
Commando VM |
flare* |
FLARE VM |
remnux* |
REMnux |
attack* |
Generic attack system |
RADIUS/NAC records provide access-decision and accounting context. A MAC or username mismatch can have benign causes and needs correlated policy, device and time evidence.
Illustrative FreeRADIUS 3.x fragment, not a whole configuration. Confirm installed paths/options. Keep password logging disabled, including debug-session handling. Upstream configuration.
Edit /etc/freeradius/3.0/radiusd.conf:
log {
    destination = syslog
    syslog_facility = local6

    # Log authentication outcomes; review identity/privacy exposure
    auth = yes
    auth_badpass = no
    auth_goodpass = no

    # Use version-supported result/reason fields; do not log passwords.
}Route the selected FreeRADIUS events without forwarding password/debug material. Use a restricted file and authenticated collector connection. Configure service reloads/restarts through the platform's change procedure after validation; do not apply a generic restart during an active authentication service without impact review.
UI labels vary by release; verify the exact ISE administration guide and authorized logging categories before applying this illustrative navigation. Choose transport and peer validation explicitly.
Configure remote syslog targets via the ISE admin console:
- Navigate to Administration → System → Logging → Remote Logging Targets
- Add your SIEM server IP and port
- Configure log categories:
- Failed Attempts
- Passed Authentications
- RADIUS Diagnostics
- Posture and Client Provisioning
Use the NPS Accounting Configuration wizard and log-file properties to choose
event, text or SQL accounting and the behavior when logging fails.
The former Set-NpsAccountingConfiguration examples were not a documented
deployment procedure and are removed.
Collect the selected file or supported event channel with an appropriate parser; a generic syslog label does not decode every NPS file format. Keep authentication outcomes distinct from accounting and validate path, encoding and rotation. See Microsoft NPS accounting.
| Event | Indication |
|---|---|
| Multiple failed auths (same MAC) | Possible guessing, client retry or configuration error |
| Successful auth after failures | Possible credential compromise |
| MAC not in database | Unknown device |
| MAC/User mismatch | Potential MAC spoofing |
| Auth from unusual location | Candidate anomaly; verify location, timing and identity |
Switch logs provide visibility into physical network changes, port security violations, and potential unauthorized device connections.
For the exact IOS/IOS-XE platform, select syslog destination, source interface, severity, timestamps and a supported secure transport. Validate the collector parser with actual message families. Logging changes must not silently change port-security enforcement or shut down ports.
Use documentation for the actual ArubaOS-Switch/ProCurve or ArubaOS-CX family. Their syntax and security models differ. Select logging destinations and event coverage without copying a generic port-range security policy.
Use the exact Junos/ELS syntax and platform documentation. Logging configuration is distinct from secure-access-port or MAC-limit policy. The former cross-version enforcement snippets are not a safe generic logging setup.
Use authenticated SNMPv3 where supported and appropriate; the former shared
public SNMPv2 community example should not be used as a default. Syslog and traps
have different formats, reliability and parser requirements.
Message identifiers and trap support depend on platform and enabled features; these are event classes to map, not portable parser rules.
| Event | OID/Log Message | Indication |
|---|---|---|
| Port Security Violation | Platform-specific message | Investigate a policy violation; not necessarily malicious |
| Link Up/Down | IF-MIB::linkDown |
Physical connection change |
| MAC Move | Platform-specific MAC-move event | Could reflect mobility, topology, duplication or spoofing; investigate |
| STP Topology Change | Platform-specific STP event | Compare approved topology and change records |
| VLAN Change | Platform-specific configuration/audit event | Verify actual committed configuration and operator identity |
Firewall logs provide perimeter visibility and are essential for detecting external attacks and data exfiltration.
Use the installed appliance's supported remote-logging configuration; pfSense and OPNsense menus and daemon behavior differ. Check transport, source address, categories and parser fixtures. Do not edit a generated syslog file directly and expect the UI to preserve it.
Add logging only at the intended existing policy decision point, with appropriate
rate limits and counters. A logging guide must not append unconditional INPUT
DROP rules. Logging is not itself a DROP verdict; an nftables log statement and
a terminating verdict are separate rule behavior.
Match the actual kernel/firewall prefix or structured fields and route the result through an approved collector action. Test quoting, rate limits and duplicates; a string prefix alone is not an authenticated source identity.
# Enable logging for dropped and successful connections
Set-NetFirewallProfile -Profile Domain,Public,Private -LogBlocked True -LogAllowed True -LogFileName "%systemroot%\system32\LogFiles\Firewall\pfirewall.log" -LogMaxSizeKilobytes 32768This collects lines only where supported; a Windows firewall log is not automatically decoded because it uses log_format=syslog. Test headers, fields, rotation and parser errors with actual sample records.
Add to ossec.conf:
<localfile>
    <location>C:\Windows\System32\LogFiles\Firewall\pfirewall.log</location>
    <log_format>syslog</log_format>
</localfile>DNS records can support investigation of unusual resolution activity, but do not by themselves identify malicious intent or cover traffic bypassing the observed resolver.
Add the following as a top-level logging statement in the effective BIND configuration, not inside an options block. Verify include structure, daemon permissions, rotation and confinement policy for these illustrative paths:
logging {
    channel query_log {
        file "/var/log/bind/query.log" versions 3 size 50m;
        severity info;
        print-time yes;
        print-category yes;
        print-severity yes;
    };

    channel security_log {
        file "/var/log/bind/security.log" versions 3 size 50m;
        severity dynamic;
        print-time yes;
    };

    category queries { query_log; };
    category security { security_log; };
};Create /etc/rsyslog.d/55-dns.conf:
# DNS query logs
module(load="imfile")
input(type="imfile" File="/var/log/bind/query.log" Tag="dns-query" Facility="local3")

# Add only the separately reviewed forwarding action for this source.
# No default unauthenticated UDP destination is configured here.
Windows DNS audit, analytic ETW and debug-file logging serve different purposes. Select required events rather than enabling every diagnostic option. Analytic query-event collection and Wazuh/Windows event-channel compatibility must be validated for the actual capture path; enabling a plugin diagnostic flag is not equivalent to enabling the analytic channel.
Choose a supported event channel or exported file path with the correct log format and parser. Verify event production and the collector's ability to read it, including channel permissions and volume impact. See Microsoft DNS logging and diagnostics.
| Pattern | Indication |
|---|---|
| High-entropy subdomains | Candidate tunneling/DGA or legitimate service identifiers |
| TXT record queries to unusual domains | Candidate anomaly; legitimate TXT usage is common |
| Queries to known-bad domains | Malware callback |
| High query volume from single host | Candidate anomaly, retry, load or possible exfiltration |
| Queries for special-use or alternative names | Application/resolver behavior; not proof of Tor use |
Set up a central rsyslog server to receive logs from all sources before forwarding to your SIEM.
Debian/Ubuntu package illustration; package names, service defaults and TLS driver availability vary by distribution and release. Inspect the effective configuration before any separately approved installation or service change.
sudo apt update
sudo apt install -y rsyslog rsyslog-gnutlsLocal plaintext illustration only: this loopback TCP input demonstrates an input bound to a dedicated ruleset; it is not a remote secure receiver. Load a module only once in the effective configuration. Prepare file permissions and validate the whole configuration before any separately approved deployment.
module(load="imtcp")

ruleset(name="remote_ingress") {
    action(type="omfile" file="/var/log/remote/received.log")
}

input(type="imtcp" address="127.0.0.1" port="5514" ruleset="remote_ingress")
Reference: imtcp input. A listener proves neither authenticated clients nor durable indexing.
Keep remote inputs in explicit rulesets and use fixed or safely encoded file paths. Message-supplied hostname/program fields are not trusted filesystem path components or authenticated identities. The former raw dynamic path and wildcard forward-all action risked unsafe naming, duplicates or forwarding loops. If forwarding is required, define a separate approved action and collector endpoint; do not point it back to the same receiver.
Choose queue limits, disk/spool access, retry and overflow behavior, and observe
suspension/drop metrics. TCP alone is not durable delivery. Disk assistance and
saveOnShutdown do not guarantee survival of a crash or power loss. See
rsyslog queue behavior.
Rotate according to the actual paths, writer, service user and distribution integration. A package-specific rotation helper is not portable across platforms. Test reopen behavior, permissions, compression and the reader's handling of renamed/truncated files. Local rotation and SIEM index retention are independent policies; neither is a backup.
Use a separately approved deployment sequence after an offline configuration
check, for example rsyslogd -N1 with the installed binary and intended
configuration. A syntax check does not establish certificate trust, reachability,
permissions or delivery. Avoid assuming that a service restart is harmless to
buffered or in-flight events. Inspect actual bind addresses and ports after deployment.
Wazuh can accept syslog with a configured remote input. The following is a restricted-network UDP illustration, not TLS or agent enrollment; validate the network boundary, allowlist and installed schema. Do not duplicate a port already used by another receiver:
<ossec_config>
    <remote>
        <connection>syslog</connection>
        <port>514</port>
        <protocol>udp</protocol>
        <allowed-ips>192.168.1.0/24</allowed-ips>
    </remote>
</ossec_config>
Validate the complete configuration and apply changes through the approved manager procedure. Wazuh remote input. Agent transport and raw syslog have different authentication and collection behavior.
Choose a version-matched input/parser and explicit ECS behavior. The syslog input already parses its expected syslog form; do not blindly parse the whole event again with an incompatible second grok expression. Preserve original text and route parse/date failures for review.
The following is an isolated loopback diagnostic illustration, not production Elasticsearch ingestion or TLS. It starts both TCP and UDP listeners when deployed.
input {
    syslog {
        host => "127.0.0.1"
        port => 5515
        ecs_compatibility => "v8"
    }
}
output {
    stdout { codec => rubydebug }
}
Use authenticated, verified output settings for the actual indexer and map the source timezone/year explicitly where absent. See the Logstash syslog input.
Reference: Splunk inputs.conf; verify the reference for the installed version.
Illustrative restricted-network plaintext inputs only; bind/transport controls and the site's input/retention policy must be verified. DNS-derived connection names are not authenticated source identities:
[udp://514]
connection_host = dns
sourcetype = syslog
index = network

[tcp://514]
connection_host = dns
sourcetype = syslog
index = networkReference: Graylog syslog inputs.
Choose the installed Graylog version's supported input and secure transport. The following describes an isolated UDP lab example, not authenticated production collection:
- Navigate to System → Inputs
- Select Syslog UDP from the dropdown
- Configure:
- Bind address: the approved collector interface; do not expose all interfaces by default
- Port:
514 - Store full message: Yes
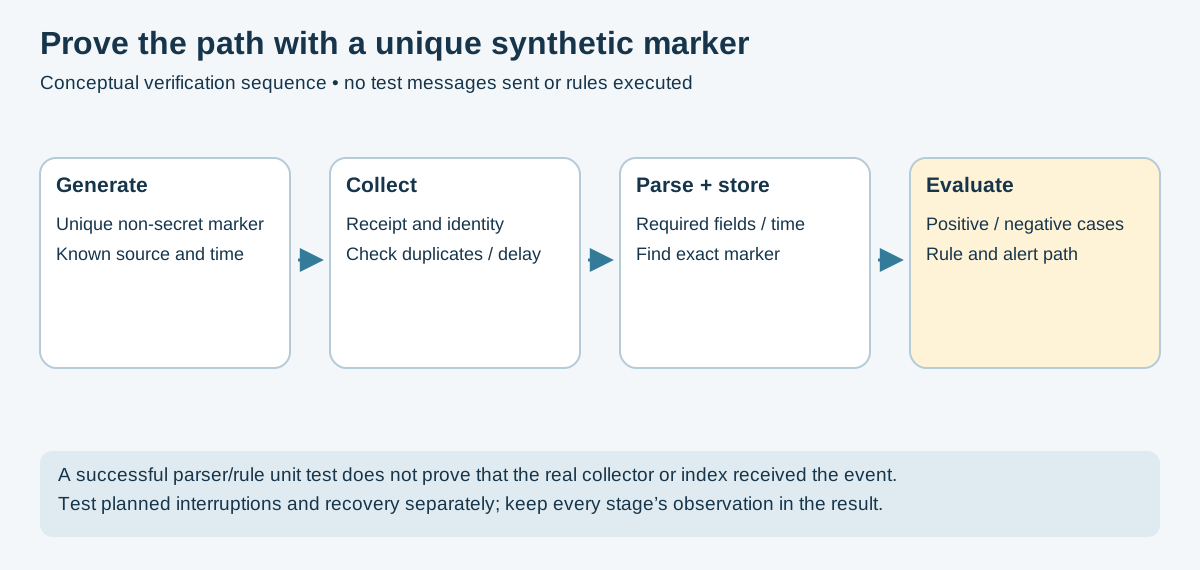
Figure 2 — Original conceptual validation plan. Wazuh logtest evaluates decoder/rule behavior, not the entire collection path. No test message or rule was executed.
These are examples for a separately authorized test, not commands run during this review. Use a unique synthetic marker without secrets, verify each stage and delete/retain test artifacts according to policy. A socket check, local parse test or a fixed wait does not establish end-to-end delivery.
# Send a test message
logger --udp -n 192.0.2.50 -P 514 -t LOG_FLOW_TEST "synthetic-marker-001"
192.0.2.50 is a documentation address; substitute an explicitly in-scope configured lab receiver and match its actual transport/port. The example sends UDP and cannot confirm receipt by itself.
Use the installed platform and release documentation to generate an approved
synthetic log event. Test commands and severity syntax differ across IOS, IOS XE,
NX-OS and other vendors; do not assume a generic send log example is portable.
Record the unique marker and verify the configured destination and severity filter.
For the fixed-file loopback example in Part 8, inspect that exact destination:
# Inspect the configured file and search the exact synthetic marker.
tail -f /var/log/remote/received.log
grep -F "synthetic-marker-001" /var/log/remote/received.log
Other collectors can use different files or storage backends. A local file match proves that stage only; record transport peer metadata separately from message fields.
# Offline decoder/rule evaluation of a provided sample; not an ingestion query.
/var/ossec/bin/wazuh-logtest < sample-log.txt
Check actual collector/agent/manager status and search the configured archive or alert/index path for the unique marker separately. A received event need not produce an alert, and archiving/indexing depends on configuration. See wazuh-logtest scope.
Use the actual authenticated HTTPS endpoint, CA verification and appropriate read-only credentials. Search the intended data stream/index and time field for the exact marker. The former generic unauthenticated HTTP query was not a current deployment recipe; finding arbitrary recent events would not prove the test event reached the intended path.
A send-and-sleep script is a smoke stimulus, not an end-to-end assertion. Record the synthetic marker and verify:
- Source generation and local serialization.
- Collector receipt, peer identity and source metadata.
- Parser success plus required fields and timestamp interpretation.
- Searchable storage and expected retention.
- Expected positive and negative rule results, when detection is in scope.
- Recovery from a planned interruption, including backlog, duplicates and drops.
Time budgets must come from the pipeline's measured behavior, not an arbitrary ten-second delay.
Check network connectivity:
Match tests to the intended transport. A UDP send or nc -zvu result cannot
prove that a syslog listener accepted, parsed or indexed an event. A TCP handshake
proves only that stage; TLS also needs trust/name validation. Any active probe
requires separate authorization and should use an in-scope endpoint.
Verify firewall rules:
# On SIEM server
sudo ufw status
sudo iptables -L -n | grep 514
Check rsyslog is listening:
sudo ss -tulnp | grep rsyslogReview rsyslog errors:
sudo journalctl -u rsyslog -fIdentify top talkers:
Use parsed, validated source fields or trusted transport metadata over a defined window. A fixed whitespace column in mixed syslog formats is not a reliable source counter. Preserve NAT/relay distinctions and compare event versus byte rates.
Routing versus rate limiting: Writing one source to a file and calling
stop changes routing; it does not rate-limit messages. Define source-appropriate
limits, overflow handling and loss metrics explicitly. Throttling may remove
security-relevant evidence, so test it with both expected and burst cases.
Test log format:
# Wazuh log testing
/var/ossec/bin/wazuh-logtest < sample-log.txt

# Logstash local input/codec smoke check; it does NOT test the production filters.
/usr/share/logstash/bin/logstash -e 'input { stdin {} } output { stdout { codec => rubydebug } }' < sample-log.txt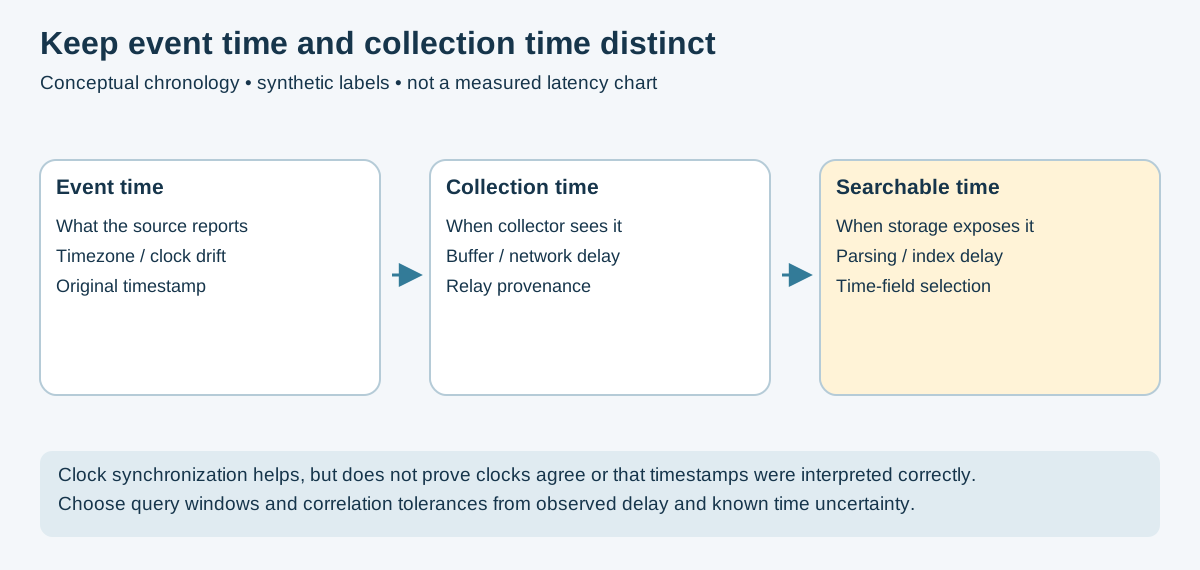
Figure 3 — Original conceptual chronology, not a measured latency chart. Field selection and parser behavior must be checked in the actual pipeline; preserve original timestamp and timezone evidence.
Record event time, collection time and timezone separately. Use a managed time source and monitor drift; enabling time synchronization alone does not prove clocks agree. Examples below require OS/platform-specific review:
# Check NTP status
timedatectl status

# Configure NTP
sudo timedatectl set-ntp true
On network devices:
! Cisco IOS
ntp server 192.168.1.10
clock timezone UTC 0
service timestamps log datetime msec localtime show-timezone
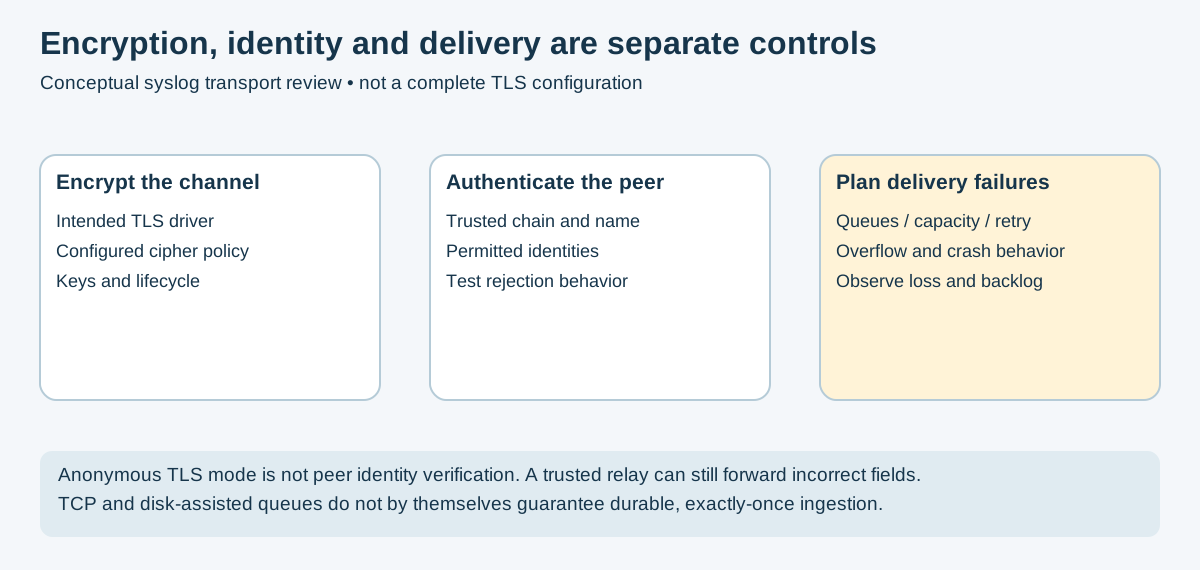
Figure 4 — Original conceptual review model based on rsyslog TLS guidance, gtls modes and queue behavior. No listener or certificate configuration was deployed.
TLS needs encryption and peer authentication. The former anon mode examples
did not authenticate certificate identity and were not a secure default.
Use the exact installed driver's documented configuration, trusted CA/certificates,
peer-name constraints, certificate/key permissions and renewal handling.
See rsyslog TLS examples
and gtls authentication modes.
| Separate Control | What To Verify |
|---|---|
| TLS encryption | The effective listener/action uses the intended encrypted transport. |
| Peer authentication | Chain, name/identity constraints, permitted senders and failure behavior. |
| Delivery resilience | Queues, capacity, retries, overflow, restart/crash behavior and loss metrics. |
| Content provenance | Authenticated relay identity does not by itself authenticate every message field. |
chattr +a sets append-only, not the immutable +i flag. Privileged actors
may change filesystem attributes, and either flag can interact with rotation or
writers. Do not treat this as WORM storage or blindly apply it to live log paths.
See the chattr manual.
Use independent access boundaries, protected retention/backup, integrity monitoring and an appropriate storage-retention design. A hash can detect changes relative to a protected baseline; it does not establish that the original event was true.
Restrict access to log servers and files:
Use the actual service account, required reader group and directory/file modes
for the installed distribution and service confinement. syslog:adm is not a
portable ownership assumption. Check parent-directory access, rotation ownership
and agent permissions together; do not broaden access merely to make collection work.
Review boundary: The four conceptual diagrams and source-reviewed examples are not a deployment certification. No listener, service, synthetic log, rule or network probe was executed. Verify version-specific behavior and source coverage before operational use.
- Rsyslog Documentation
- Wazuh Log Collection
- Elastic Common Schema
- NIST SP 800-92 — Guide to Computer Security Log Management
These facilities are site-selected routing examples, not universal source identifiers. Actual collectors may use agents, files, APIs or product protocols instead of syslog; verify every source path.
| Source | Port | Protocol | Facility |
|---|---|---|---|
| Kismet (Wireless IDS) | 514 | UDP/TCP | local5 |
| DHCP Server | 514 | UDP/TCP | local7 |
| RADIUS | 514 | UDP/TCP | local6 |
| Network Switches | 514 | UDP/TCP | local4 |
| Firewalls | 514 | UDP/TCP | local0 |
| DNS Servers | 514 | UDP/TCP | local3 |
| Command | Purpose |
|---|---|
systemctl restart rsyslog |
Restart rsyslog service |
rsyslogd -N1 |
Check configuration syntax |
logger --udp -n <approved-receiver> -P <configured-port> "synthetic-marker" |
Send UDP stimulus; receipt is unconfirmed |
tcpdump -i <approved-interface> port <configured-port> |
Capture only on an authorized interface; traffic does not prove parsing/indexing |
- Required sources inventoried with explicit collector/export path and known coverage gaps
- Central rsyslog server receiving logs
- Unique synthetic marker verified at each stage, including parser and searchable storage
- Parsing rules validated
- Time synchronization confirmed
- Log retention policy implemented
- Positive/negative detection fixtures and false-positive baselines checked
- Required encryption, peer identity and delivery-failure behavior validated
- README.md - IncidentResponse section index: all IR and forensics guides
- network_intrusion.md - Network intrusion IR playbook: the log sources configured here are what feeds that detection
- ../Documentation/wireshark.md - Wireshark complements log aggregation: captures what syslog misses at the packet level
- ../Homelab/ - Homelab build: the hardware platform where this log aggregation infrastructure runs
Part of the Incident Response & Log Aggregation Branch
📄 Source: IncidentResponse/log_agg.md | ✏️ Suggest an edit | ⬅️ Back to Incident Response