Repository navigation
Manjaro Linux Dedicated Hardware Testing and Benchmarking PC Intel CPU
Quick reference for hardware diagnostics, stress testing, benchmarking, and reliability validation on a dedicated Manjaro Linux test bench with Intel CPU.
Covers: CPU stress testing (stress-ng, Prime95), memory testing (memtest86+, memtester), storage diagnostics (smartctl, badblocks, fio), GPU testing (glmark2, GPU-Burn), thermal monitoring, system profiling (sysbench, Phoronix Test Suite), and interpreting results.
Enable systematic hardware qualification testing on a dedicated Manjaro/Intel bench system with consistent test procedures and pass/fail criteria for each component.
- Running hardware acceptance testing on a new system
- Diagnosing thermal or stability issues under load
- Benchmarking for performance baseline before lab deployment
- Stress testing before RMA decision on suspected faulty hardware
This document is a quick reference for hardware diagnostics, stress testing, benchmarking, and reliability validation on a dedicated Manjaro Linux test bench.
It is specifically tailored for modern Intel CPU test benches, especially Z790 motherboards and 13th/14th Gen Core i9 processors, but many of the tools and workflows apply broadly to modern PC hardware diagnostics.
Manjaro is based on Arch Linux. Instead of Debian/Ubuntu’s apt, Manjaro primarily uses pacman for official repository packages and pamac for Manjaro’s package-management frontend, including optional AUR support.
The Arch User Repository (AUR) is a community-maintained collection of package build scripts. It is extremely useful for diagnostics and benchmarking tools that are not available in the official repositories, but AUR packages should always be reviewed with care before installation.
| Command | Purpose | Explanation |
|---|---|---|
sudo pacman -Syu |
System update | Synchronizes repositories and updates all installed packages. Run this before installing tools or beginning a test baseline. |
sudo pacman -S [pkg] |
Install package | Installs a package from the official Manjaro/Arch repositories. |
sudo pacman -S --needed [pkg] |
Install only if needed | Installs missing packages without reinstalling packages already present. |
sudo pacman -Rns [pkg] |
Remove package cleanly | Removes the package, unused dependencies, and related configuration where appropriate. |
pacman -Qdt |
List orphaned dependencies | Lists packages installed as dependencies that are no longer required. |
sudo pacman -Sc |
Clean package cache | Removes old cached package files. Use carefully if you want to preserve downgrade options. |
pamac build [pkg] |
Build from AUR | Builds and installs an AUR package, such as optional proprietary or third-party benchmark tools. |
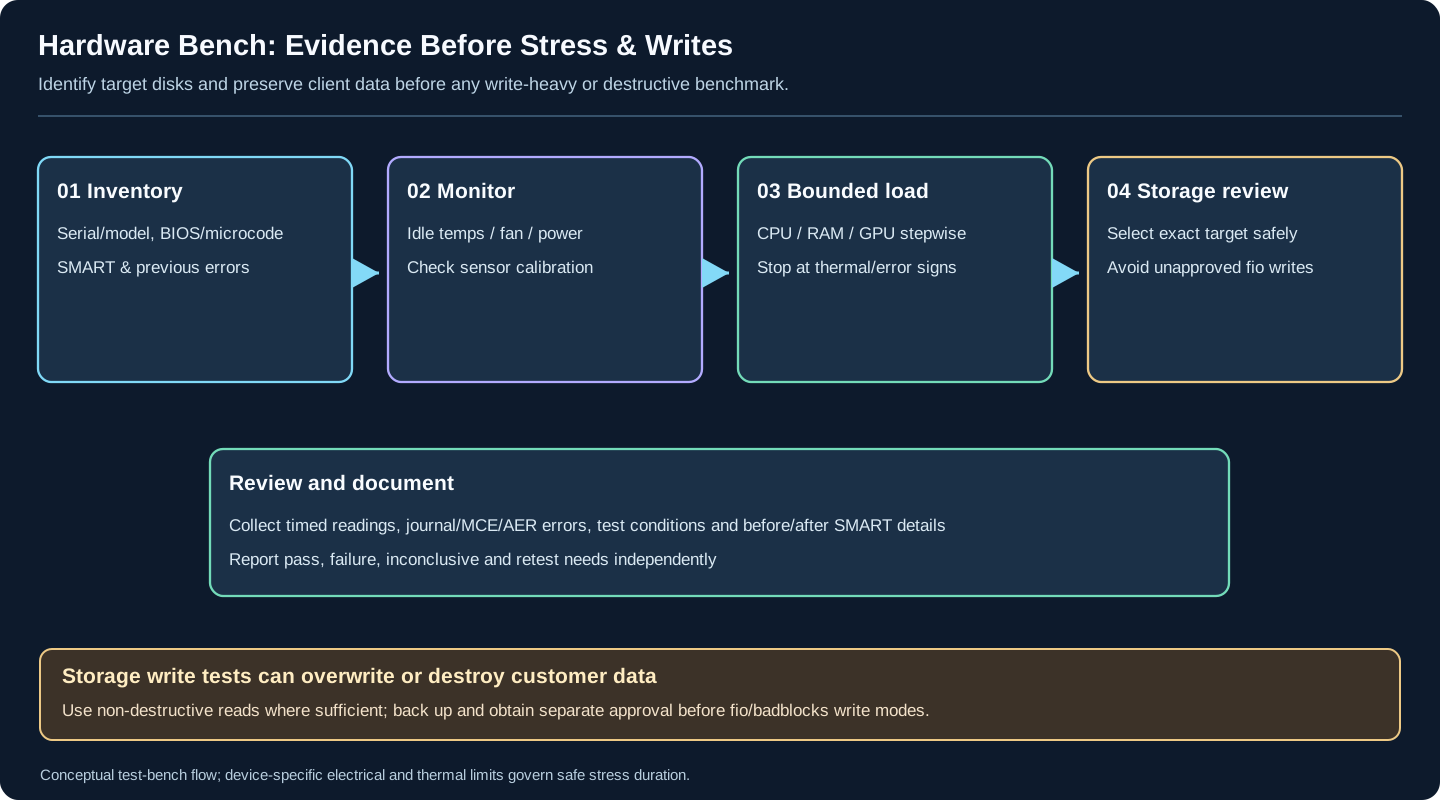
Conceptual diagnostic workflow. fio's official documentation distinguishes job I/O direction, target paths and destructive write operations. fio and especially badblocks -w can overwrite client data when configured against the wrong block device. Confirm the target, back up data, use read-only methods where sufficient and obtain explicit approval before any write-intensive or destructive test. Temperature and performance limits depend on the specific hardware and firmware.
These commands are useful before running any benchmark. They establish the hardware baseline, firmware/BIOS details, RAM layout, PCIe topology, and obvious kernel-level hardware errors.
| Command | Purpose | Explanation |
|---|---|---|
inxi -Fzx -c0 |
Full system specs | Provides a readable summary of CPU, RAM, motherboard, GPU, storage, network, and drivers. |
sudo dmidecode -t memory |
RAM topology | Reads DMI data to show installed RAM modules, slots, speeds, manufacturer, and part numbers. |
sudo dmidecode -t baseboard |
Motherboard info | Displays motherboard vendor, model, serial, and board revision. |
sudo dmidecode -t bios |
BIOS/UEFI info | Shows BIOS vendor, version, and release date. Important for Z790/13th/14th Gen stability checks. |
lscpu |
CPU architecture | Shows CPU topology, P-core/E-core layout, threads, cache, and CPU feature flags. |
lspci -nnk |
PCIe devices and drivers | Shows PCIe devices and the kernel driver currently bound to each device. |
sudo lspci -vv |
Detailed PCIe state | Shows PCIe link capabilities, negotiated speed, negotiated width, ASPM, and device details. |
journalctl -k -p warning..alert --no-pager |
Kernel warnings/errors | Reviews kernel warnings and hardware-related errors. |
journalctl -k --since "1 hour ago" --no-pager |
Recent kernel log | Useful after a stress test to check for MCE, PCIe AER, GPU reset, storage, or thermal events. |
dmesg | grep -Ei "throttl|thermal|mce|hardware error|pcie|aer" |
Quick fault scan | Quick grep for common thermal, CPU, PCIe, and hardware error messages. |
With high-end Intel CPUs, especially i9-class chips, thermal behavior and power-limit behavior are critical. Always establish whether the system is failing because of hardware instability, bad cooling, poor mounting pressure, BIOS power behavior, or a true component fault.
| Command | Purpose | Explanation |
|---|---|---|
sudo sensors-detect --auto |
Sensor setup | Detects supported motherboard and CPU sensors. Run once after installing lm_sensors. |
watch -n 1 sensors |
Basic thermal watch | Displays temperatures, voltages, and fan readings every second. |
s-tui |
Terminal UI monitor | Visual terminal monitor for CPU frequency, utilization, temperature, and power. Package availability can vary; install from repo or AUR depending on Manjaro branch. |
sudo turbostat |
Intel CPU telemetry | Shows C-states, frequencies, package power, throttling behavior, and power-limit behavior on supported Intel CPUs. Package availability can vary by kernel/tooling package. |
sudo modprobe msr |
Enable MSR access | May be required before some Intel telemetry tools can read power/frequency data. |
sudo intel_gpu_top |
Intel iGPU monitor | Monitors Intel integrated graphics utilization. Requires intel-gpu-tools. |
nvtop |
GPU monitor | TUI GPU monitor that can support Intel, AMD, and NVIDIA depending on installed drivers/libraries. |
Use CPU tests to validate cooling, boost behavior, BIOS power limits, and basic CPU stability. For a staged acceptance test, choose bounded CPU, memory, GPU and separately approved storage workloads appropriate to the specific unit. Review the Python stress_soak.py script's actual operations and resource limits before executing; simultaneous heavy load is not automatically the safest final test, especially on a customer system containing data.
| Command | Purpose | Explanation |
|---|---|---|
stress-ng --cpu 0 --timeout 10m --metrics-brief |
General CPU stress | Uses all detected CPU threads. Good for basic cooling and stability checks. |
stress-ng --matrix 0 --timeout 5m --metrics-brief |
FPU/matrix stress | High-power floating-point workload that can quickly expose cooling limits. |
stress-ng --cpu 0 --cpu-method all --timeout 10m --metrics-brief |
Broad CPU stress | Cycles through multiple CPU stress methods for wider instruction coverage. |
sysbench cpu --cpu-max-prime=20000 --threads="$(nproc)" run |
CPU benchmark | CPU arithmetic benchmark useful for repeatable comparison. |
mprime -t |
Prime95/mprime torture test | Commonly used for CPU/RAM stability validation, especially overclock/XMP/EXPO checks. |
Note on P-cores and E-cores: Modern Linux kernels support Intel hybrid CPU scheduling much better than older kernels. However, workload placement can still vary by kernel, desktop environment, BIOS settings, and scheduler behavior. For repeatable testing, keep kernel version, BIOS settings, power profile, and background load consistent.
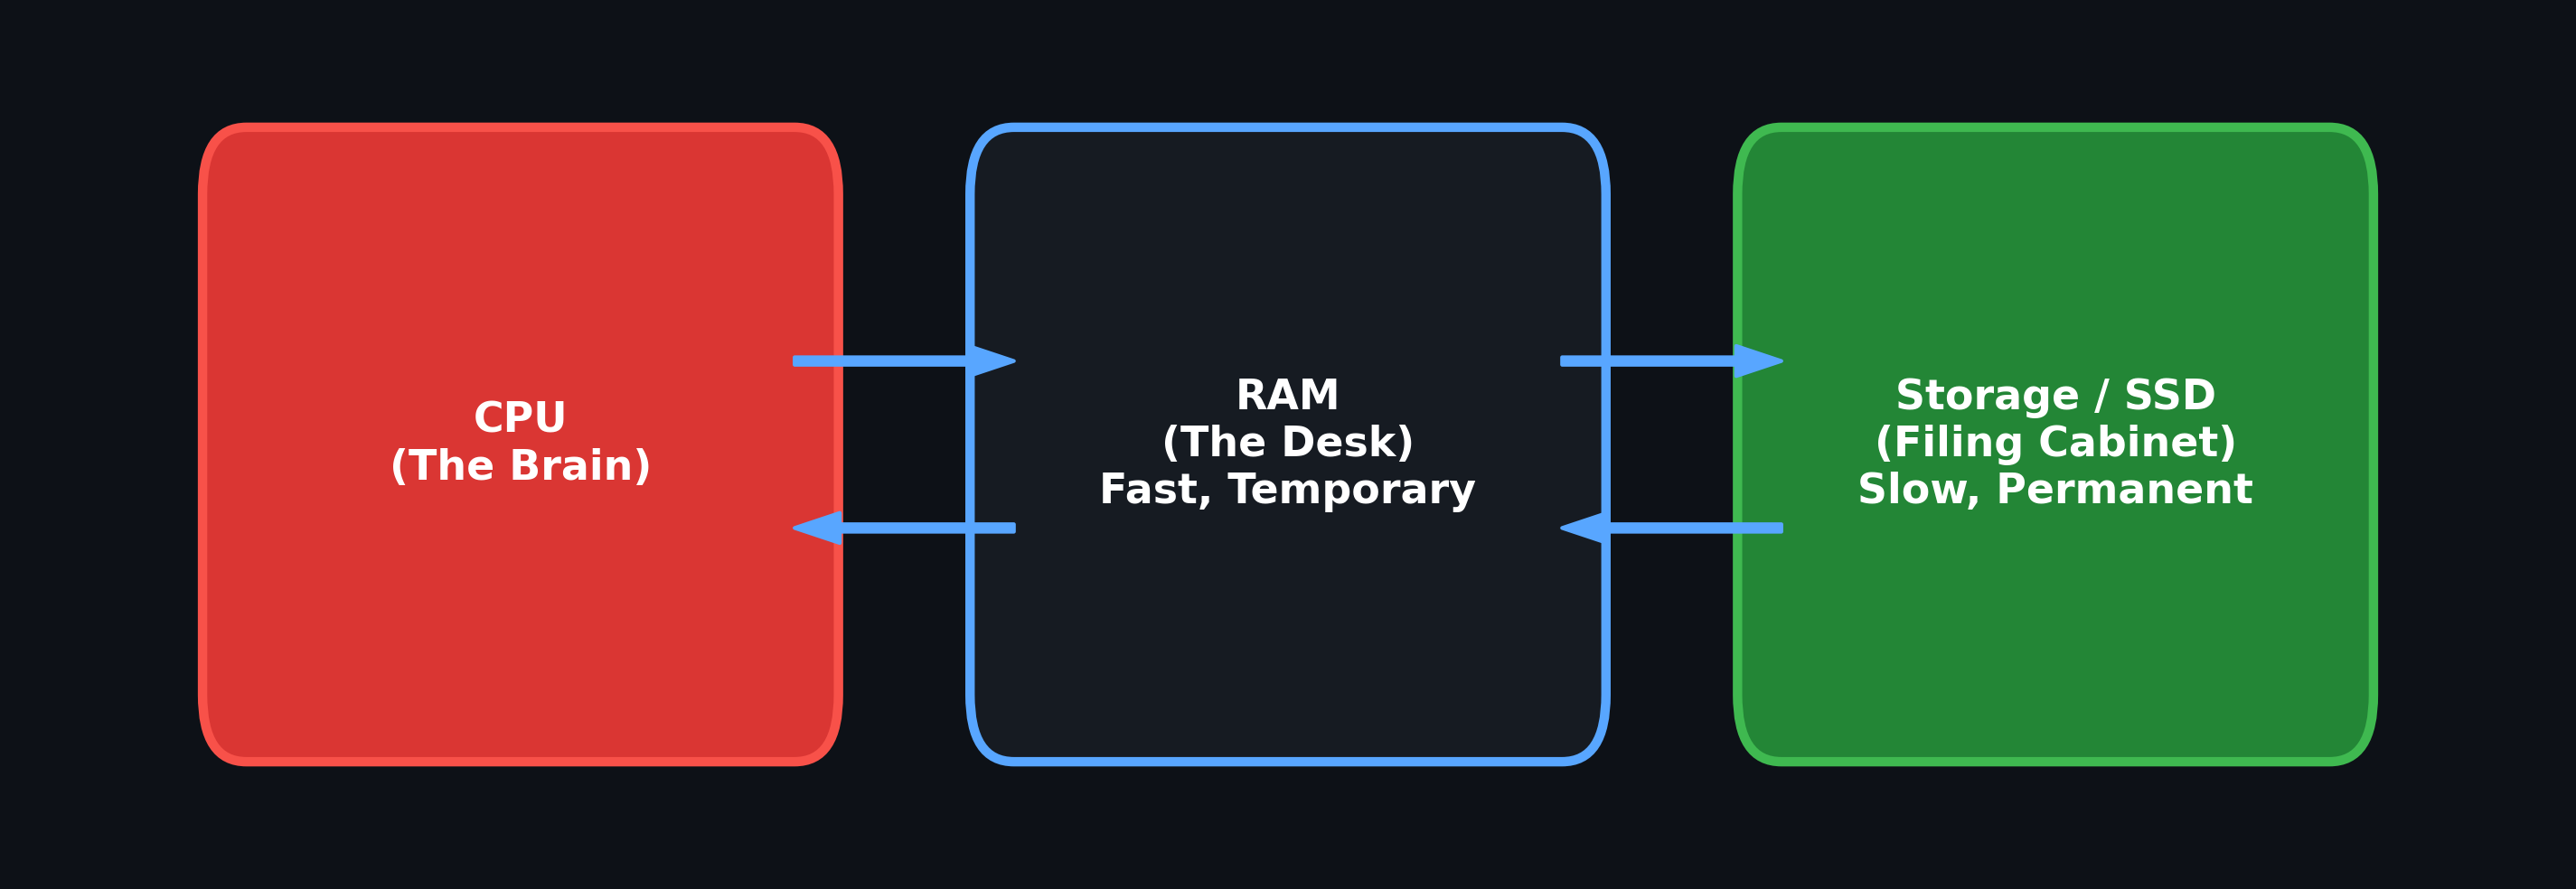
Conceptual comparison: CPU performs computation; RAM holds actively used data; persistent storage retains files across power loss. Actual cache, memory, swap and storage behavior is more nuanced.
Memory and storage problems can mimic CPU, GPU, or OS instability. Validate RAM and storage before blaming drivers or software.
| Command | Purpose | Explanation |
|---|---|---|
sudo memtester 16G 5 |
User-space RAM test | Allocates 16GB and runs 5 passes of memory pattern tests. Any FAILED line is serious. |
sudo python3 py/standalone_ram_tester.py --client "Client Name" --memtester-size 4G --passes 3 |
Automated RAM report | PNWC RAM script with bandwidth, memtester, kernel memory fault scanning, and Markdown report. |
sudo nvme smart-log /dev/nvme0n1 |
NVMe health | Shows NVMe temperature, media errors, percentage used, unsafe shutdowns, and data written/read. |
sudo smartctl -a /dev/sda |
SATA SMART data | SMART report for SATA SSDs and HDDs. |
sudo smartctl -a /dev/nvme0n1 |
SMART via smartctl | Alternate SMART view for NVMe devices through smartmontools. |
fio --name=randrw-4k --ioengine=libaio --iodepth=64 --rw=randrw --bs=4k --direct=1 --size=4G --numjobs=4 --runtime=60 --group_reporting --filename=testfile.fio |
4K random storage test | Enterprise-grade random read/write benchmark. Run from the mount point of the drive being tested. |
kdiskmark |
GUI storage benchmark | CrystalDiskMark-style GUI benchmark for Linux. Useful for quick client-facing storage comparisons. |
Run these commands on a fresh Manjaro installation to provision the system with the core diagnostic, benchmarking, monitoring, GPU, and reliability tools used by the PNWC scripts.
sudo pacman -Syu --neededInstalls core build tools, Python, system info utilities, sensor tools, storage diagnostics, CPU/RAM/storage stress tools, Vulkan/OpenGL tooling, Intel GPU tools, and terminal GPU monitors.
sudo pacman -S --needed \
  base-devel git make gcc cmake ninja pkgconf rust cargo \
  python python-pip curl unzip jq \
  inxi dmidecode pciutils usbutils lshw hwinfo \
  lm_sensors smartmontools nvme-cli \
  sysbench memtester stress-ng fio \
  vulkan-tools mesa-utils \
  vkmark glmark2 \
  intel-gpu-tools nvtop \
intel-ucodeInstall this block if the bench may test AMD Radeon GPUs.
sudo pacman -S --needed \
  mesa vulkan-radeon \
  amdsmi amdgpu_top radeontop
Useful AMD checks:
inxi -G -c0
lspci -nnk | grep -A4 -E "VGA|3D|Display"
vulkaninfo --summary
glxinfo -B
amd-smi list
amd-smi static --gpu 0
amd-smi metric --gpu 0
amdgpu_top --dumpInstall this block if the bench may test NVIDIA GPUs.
sudo pacman -S --needed \
  nvidia-utils cuda opencl-nvidia
Useful NVIDIA checks:
nvidia-smi
nvidia-smi -q
nvcc --version
vulkaninfo --summary
glxinfo -B
Driver note: On Manjaro, NVIDIA driver installation may also involve Manjaro Hardware Detection (
mhwd) or the Manjaro Settings Manager.nvidia-utilsprovides tools such asnvidia-smi, but the correct driver stack must also be installed and loaded.
memtest_vulkan is used by the GPU scripts for VRAM stability testing. It is useful for AMD, NVIDIA, and Intel GPUs as long as the system exposes a working Vulkan device.
mkdir -p ~/src
cd ~/src

if [ ! -d memtest_vulkan ]; then
  git clone https://github.com/GpuZelenograd/memtest_vulkan.git
fi

cd memtest_vulkan
git pull
cargo build --release
sudo install -m 755 target/release/memtest_vulkan /usr/local/bin/memtest_vulkan
Verify:
command -v memtest_vulkan
memtest_vulkan
Stop the test with Ctrl+C after confirming it starts and detects the correct GPU.
gpu-burn is NVIDIA/CUDA-specific. It is only needed for NVIDIA diagnostic runs that use the --gpu-burn option.
mkdir -p ~/src
cd ~/src

if command -v nvcc >/dev/null 2>&1; then
  if [ ! -d gpu-burn ]; then
    git clone https://github.com/wilicc/gpu-burn.git
  fi

  cd gpu-burn
  git pull
  make

  sudo install -m 755 gpu_burn /usr/local/bin/gpu-burn
  sudo ln -sf /usr/local/bin/gpu-burn /usr/local/bin/gpu_burn
else
  echo "nvcc was not found. Skipping gpu-burn build."
  echo "Install/repair CUDA first if this bench needs NVIDIA gpu-burn testing."
fi
Verify:
gpu-burn -l
gpu-burn 60Some specialized tools are not always available in the official repositories or may be easier to install through pamac.
pamac build \
  mprime-bin \
  kdiskmark \
  unigine-superposition \
  phoronix-test-suite \
  gputest
Optional FurMark/GpuTest note: GpuTest/FurMark is retained as a legacy thermal torture path only. The modern GPU validation path should prioritize
memtest_vulkan,vkmark,glmark2, vendor telemetry, and kernel fault scanning.
Linpack note: Standalone Linpack packages can be inconsistent depending on source availability and packaging. Prefer Phoronix Test Suite for standardized Linpack runs when needed.
Run once after installing lm_sensors.
sudo sensors-detect --auto
sensors
This is required for sensors, many thermal snapshots, and the thermal logging used by stress_soak.py.
Install Intel microcode and make sure the bootloader/initramfs configuration is applying it correctly for your Manjaro setup.
sudo pacman -S --needed intel-ucodeRun this after installing the base tools, GPU tools, optional benchmark tools, memtest_vulkan, and gpu-burn.
echo "== Core script tools =="
for bin in \
  python git make gcc cmake ninja cargo rustc \
  inxi dmidecode lspci lsusb lshw hwinfo \
  sysbench memtester fio stress-ng \
  smartctl nvme sensors \
  glmark2 vkmark vulkaninfo glxinfo \
  intel_gpu_top nvtop; do
  printf "%-22s %s\n" "$bin" "$(command -v "$bin" || echo '❌ NOT FOUND')"
done

echo
echo "== AMD tools =="
for bin in amd-smi amdgpu_top radeontop; do
  printf "%-22s %s\n" "$bin" "$(command -v "$bin" || echo 'optional / not installed')"
done

echo
echo "== NVIDIA tools =="
for bin in nvidia-smi nvcc gpu-burn gpu_burn; do
  printf "%-22s %s\n" "$bin" "$(command -v "$bin" || echo 'optional / not installed')"
done

echo
echo "== GPU VRAM test =="
for bin in memtest_vulkan; do
  printf "%-22s %s\n" "$bin" "$(command -v "$bin" || echo '❌ NOT FOUND')"
done

echo
echo "== Optional/manual tools =="
for bin in mprime kdiskmark phoronix-test-suite GpuTest s-tui turbostat; do
  printf "%-22s %s\n" "$bin" "$(command -v "$bin" || echo 'optional / not installed')"
doneIf this repository includes the helper installer script, it can be used after reviewing its contents:
bash install_testbench_tools.shReview the script before running it, especially the AUR and source-build sections.
For deeper storage analysis, use fio. Run from the mount point of the drive being tested.
fio --name=randrw-4k \
  --ioengine=libaio \
  --iodepth=64 \
  --rw=randrw \
  --bs=4k \
  --direct=1 \
  --size=4G \
  --numjobs=4 \
  --runtime=60 \
  --group_reporting \
  --filename=testfile.fio
Warning: This creates a 4GB
testfile.fioin the current directory. Make sure you are on the target drive before running it.
Clean up afterward:
rm -f testfile.fioPhoronix Test Suite is useful for standardized benchmark runs and repeatable comparative testing. It can be especially helpful when you want more formal benchmark result organization than the repair-bench scripts provide.
| Task | Command |
|---|---|
| List available tests | phoronix-test-suite list-available-tests |
| System info summary | phoronix-test-suite system-info |
| Run CPU benchmarks | phoronix-test-suite benchmark cpu |
| Run memory benchmarks | phoronix-test-suite benchmark memory |
| Run Linpack benchmark | phoronix-test-suite benchmark pts/linpack |
| List installed tests | phoronix-test-suite list-installed-tests |
The modern GPU testing path treats FurMark/GpuTest as optional, not as the main diagnostic engine.
The standard validation path is:
- Confirm GPU hardware and driver binding with
inxi,lspci, and vendor tools. - Confirm Vulkan device visibility with
vulkaninfo --summary. - Confirm OpenGL renderer with
glxinfo -B. - Run
memtest_vulkanfor VRAM stability. - Run
vkmarkfor Vulkan rendering/load testing. - Run
glmark2for OpenGL rendering/load testing. - Track vendor telemetry during load.
- Scan kernel logs for GPU resets, PCIe AER, Xid/NVRM, amdgpu ring timeouts, i915 hangs, DRM faults, and VM faults.
- Generate a Markdown report and retain CSV telemetry logs where available.
| Command | Purpose | Explanation |
|---|---|---|
vulkaninfo --summary |
Vulkan validation | Confirms Vulkan sees the expected physical GPU and not only a software renderer. |
glxinfo -B |
OpenGL validation | Confirms the OpenGL renderer and driver path. |
memtest_vulkan |
VRAM stability | Cross-vendor Vulkan memory stress test. |
vkmark |
Vulkan benchmark | Standardized Vulkan rendering benchmark. |
glmark2 |
OpenGL benchmark | Standardized OpenGL/OpenGL ES rendering benchmark. |
nvtop |
GPU monitor | Visual terminal GPU monitor for supported Intel, AMD, and NVIDIA setups. |
unigine-superposition |
3D benchmark | Optional visually demanding benchmark for manual GPU load testing. |
GpuTest |
Legacy FurMark/GpuTest | Optional legacy thermal torture test; not the primary validation path. |
NVIDIA diagnostics rely on a properly installed NVIDIA driver stack and nvidia-utils.
| Command | Purpose | Explanation |
|---|---|---|
nvidia-smi |
GPU snapshot | Driver/CUDA status, VRAM usage, temperature, power, clocks, and utilization. |
watch -n 1 nvidia-smi |
Live monitor | Refreshes nvidia-smi every second during load. |
nvidia-smi dmon |
Device monitor | Compact telemetry stream useful for logging. |
nvidia-smi -q |
Detailed query | Full detailed NVIDIA device query. |
gpu-burn 300 |
CUDA stress | NVIDIA CUDA compute stress test. Use carefully on known-good cooling. |
nvidia-settings |
GUI panel | Optional GUI for NVIDIA display/settings when installed and available. |
Modern AMD Radeon cards use the amdgpu kernel driver. Many useful telemetry values are exposed through sysfs and AMD tooling.
| Command | Purpose | Explanation |
|---|---|---|
amd-smi list |
AMD GPU list | Lists AMD GPUs detected by AMD SMI. |
amd-smi static --gpu 0 |
Static info | Static device properties for GPU 0. |
amd-smi metric --gpu 0 |
Live metrics | Temperature, clocks, power, utilization, and other metrics where supported. |
amdgpu_top --dump |
Detailed AMD snapshot | Detailed AMD GPU utilization/clock/VRAM snapshot. |
radeontop |
Graphics pipe monitor | TUI showing Radeon hardware block utilization. |
cat /sys/class/drm/card*/device/pp_dpm_sclk |
DPM clocks | Shows available and active core clock DPM states. |
cat /sys/class/drm/card*/device/pp_dpm_mclk |
Memory clocks | Shows available and active memory clock DPM states. |
cat /sys/class/drm/card*/device/pp_dpm_pcie |
PCIe state | Shows available and active PCIe speed/width states where exposed. |
AMD debugfs note: Some older commands such as
/sys/kernel/debug/dri/0/amdgpu_pm_inforequire debugfs access, root permissions, and the correct DRI card index. Prefer sysfs andamd-smi/amdgpu_topwhere possible.
The Python scripts are located in the py/ subdirectory. They orchestrate proven CLI tools, stream output live, watch for kernel faults, and generate client-facing Markdown reports.
Run the following commands from the repository’s Hardware Testing directory unless otherwise noted.
Runs a full sequential diagnostic pass:
System info → CPU benchmark → RAM bandwidth/stability → storage SMART/IOPS → GPU benchmark.
Requires sudo because memtester and dmidecode need elevated privileges.
sudo python3 py/full_hw_suite.py --client "Client Name"For storage testing, run from the mount point of the drive you want to test, or confirm where the script creates its temporary
fiotest file.
General first-pass GPU validation for Intel, AMD, and NVIDIA GPUs.
It checks hardware with inxi/lspci, validates Vulkan/OpenGL renderers, warns on software rendering, optionally runs memtest_vulkan and vkmark, runs glmark2, and scans kernel logs for GPU/PCIe faults.
For a serious suspected AMD or NVIDIA card failure, run the vendor-specific scripts afterward for richer per-second telemetry.
python3 py/standalone_gpu_tester.py --client "Client Name"Quick smoke test:
python3 py/standalone_gpu_tester.py --quick --client "Client Name"Longer OpenGL timed soak:
python3 py/standalone_gpu_tester.py --glmark2-run-forever --glmark2-timeout 900 --client "Client Name"Skip optional tests:
python3 py/standalone_gpu_tester.py --no-memtest --no-vkmark --client "Client Name"Dedicated diagnostic path for Radeon GPUs.
The AMD script uses amdgpu sysfs as the baseline telemetry path and collects amd-smi / amdgpu_top snapshots when available. It should not fail a consumer Radeon card just because ROCm/SMI support is incomplete.
Features include:
-
--card-indexsupport. - PCIe current/max sysfs checks.
-
amd-smiandamdgpu_topsnapshots. -
memtest_vulkan,vkmark, andglmark2. - Optional FurMark/GpuTest mode.
- Kernel GPU/PCIe fault scanning.
- Markdown report with stricter verdict logic.
python3 py/amd_gpu_tester.py --client "Client Name"More aggressive OpenGL stress mode:
python3 py/amd_gpu_tester.py --client "Client Name" --glmark2-run-forever --glmark2-timeout 900Optional FurMark/GpuTest mode:
python3 py/amd_gpu_tester.py --client "Client Name" --furmarkDedicated diagnostic path for GeForce, Quadro, RTX, and other NVIDIA GPUs.
Features include:
-
--gpu-indexsupport. - Dynamic
nvidia-smifield probing. - PCIe link tracking during load.
- Throttle tracking.
- ECC checks where supported.
-
memtest_vulkan,vkmark, andglmark2. - Optional
gpu-burn. - Optional FurMark/GpuTest mode.
- Kernel GPU/PCIe fault scanning.
- Markdown report with complete verdict logic.
python3 py/nvidia_gpu_tester.py --client "Client Name"More aggressive OpenGL stress mode:
python3 py/nvidia_gpu_tester.py --client "Client Name" --glmark2-run-forever --glmark2-timeout 900Optional NVIDIA CUDA stress:
python3 py/nvidia_gpu_tester.py --client "Client Name" --gpu-burnOptional FurMark/GpuTest mode:
python3 py/nvidia_gpu_tester.py --client "Client Name" --furmarkTests RAM in isolation.
Reads hardware topology from dmidecode, runs sysbench memory bandwidth, then runs memtester for bit-pattern stability validation. Output streams live and kernel logs are scanned for MCE, EDAC, OOM, and memory faults.
Requires sudo.
sudo python3 py/standalone_ram_tester.py --client "Client Name" --memtester-size 4G --passes 3Use --auto-size if you want the script to choose a safer allocation based on available memory:
sudo python3 py/standalone_ram_tester.py --client "Client Name" --auto-size --passes 3Purpose-built for reliability validation.
Unlike the diagnostic scripts, this runs CPU, RAM, storage, and GPU load simultaneously for longer periods. It is designed to expose issues that quick sequential tests can miss, such as thermal soak, marginal cooler mounts, combined-load PSU issues, VRM thermal limits, and XMP/EXPO instability.
Requires sudo. Run from a desktop terminal for GPU stress, or use --skip-gpu for headless testing.
sudo python3 py/stress_soak.py --mode standard --client "Client Name"Available modes:
quick      ~15 minutes
short      ~1 hour
standard   ~4 hours
extended   ~8 hours
overnight  ~24 hours
Skip GPU stress:
sudo python3 py/stress_soak.py --mode standard --client "Client Name" --skip-gpuZ790 platforms and 13th/14th Gen Intel CPUs have received many BIOS updates affecting microcode, power limits, voltage behavior, and stability defaults. Update BIOS/UEFI before establishing a benchmark baseline or declaring a CPU/motherboard unstable.
Document the BIOS power profile before testing. Results can differ dramatically between unrestricted motherboard defaults, Intel baseline/default profiles, undervolts, XMP profiles, and vendor “enhancement” options.
Manjaro offers multiple kernels. Test on a current stable or LTS kernel supported by Manjaro and appropriate for the hardware. Avoid writing benchmark baselines against an old kernel unless the client system must remain on that kernel.
Install and apply Intel microcode updates. Re-test after BIOS or microcode changes because boost behavior, voltage behavior, and stability can change.
Always test RAM at both default JEDEC and XMP/EXPO settings when diagnosing instability. A system that fails only with XMP/EXPO enabled may have a memory-controller, motherboard, BIOS, or RAM timing issue rather than a fully bad RAM module.
If the CPU immediately hits thermal limits under stress-ng, mprime, or turbostat observation, physically inspect cooler mounting pressure, paste spread, pump/fan behavior, and case airflow before assuming the CPU is defective.
Run storage benchmarks from the mount point of the drive being tested. Otherwise, you may accidentally benchmark the OS drive or the wrong filesystem.
Do not rely on benchmark score alone. Combine VRAM testing, Vulkan/OpenGL validation, vendor telemetry, thermals, PCIe link state, and kernel logs before calling a GPU good or bad.
Last Updated: 06-11-2026
- README.md - HardwareTesting section index
- py/README.md - Python scripts that automate these test procedures
- ../Homelab/HomeLab_Setup.md - Homelab where test bench lives
📄 Source: HardwareTesting/Manjaro_Intel_TestBench.md | ✏️ Suggest an edit | ⬅️ Back to Hardware Testing