Repository navigation
first pattern
Home > Your first pattern
< Previous: Interface tour | Next: Canvas basics >
A short hands-on walkthrough - build a small construction, then drive it from the node graph.
This two-part walkthrough builds a small construction by hand and then feeds it into the node graph. It assumes a fresh, blank document, and precision doesn't matter yet - the goal is to feel how the pieces connect.
Part 1 shows the two ideas that make Locus tick: geometry stays associative - it updates the moment its inputs move - and a point can be pinned to a curve so it slides along it.

Choose Draw > Points and click twice on the canvas to drop two points. Then press Esc.
Important
Press Escape between commands. Escape does two things: it finishes the tool you're in, and it clears your current selection. That second part matters - most Locus commands will pick up whatever geometry you already have selected and use it as their input if they can, so a leftover selection can quietly feed into your next command and change what it does. Pressing Esc first gives each command a clean slate. Build the habit now: command -> Escape -> next command.

Choose Draw > Circle: Center Point. Click the first point to set the center, then the second point to set the radius - a circle appears, passing through that second point. Then press Esc.
Grab either point and move it. The circle follows - drag the center and the whole circle slides; drag the outer point and the circle grows or shrinks. That's associativity: the circle remembers it's defined by those two points, so it updates whenever they do.

- Press Esc to clear any selection, then choose Draw > Segment.
- Click the point that sits on the circle, then click anywhere along the circle itself for the segment's far end. Because that second click lands on the circle, Locus binds the new point to it - a glider - and draws a segment between the two points. Then press Esc.
Grab the new point and move it. Instead of moving freely, it slides along the circle - it's locked to that curve, not to a fixed spot in space.
Now drag the original outer point again to resize the circle. The glider stays on the circle as it changes size - it's attached to the curve, so it travels wherever the curve goes.
That's the whole idea in one small sketch: every object remembers what defines it, and a point can ride a curve wherever that curve leads.
Part 1 stayed in the Modeling window. Part 2 sends that geometry across into the Nodes window, where you can repeat and transform it - and it all stays connected to the construction you drew.
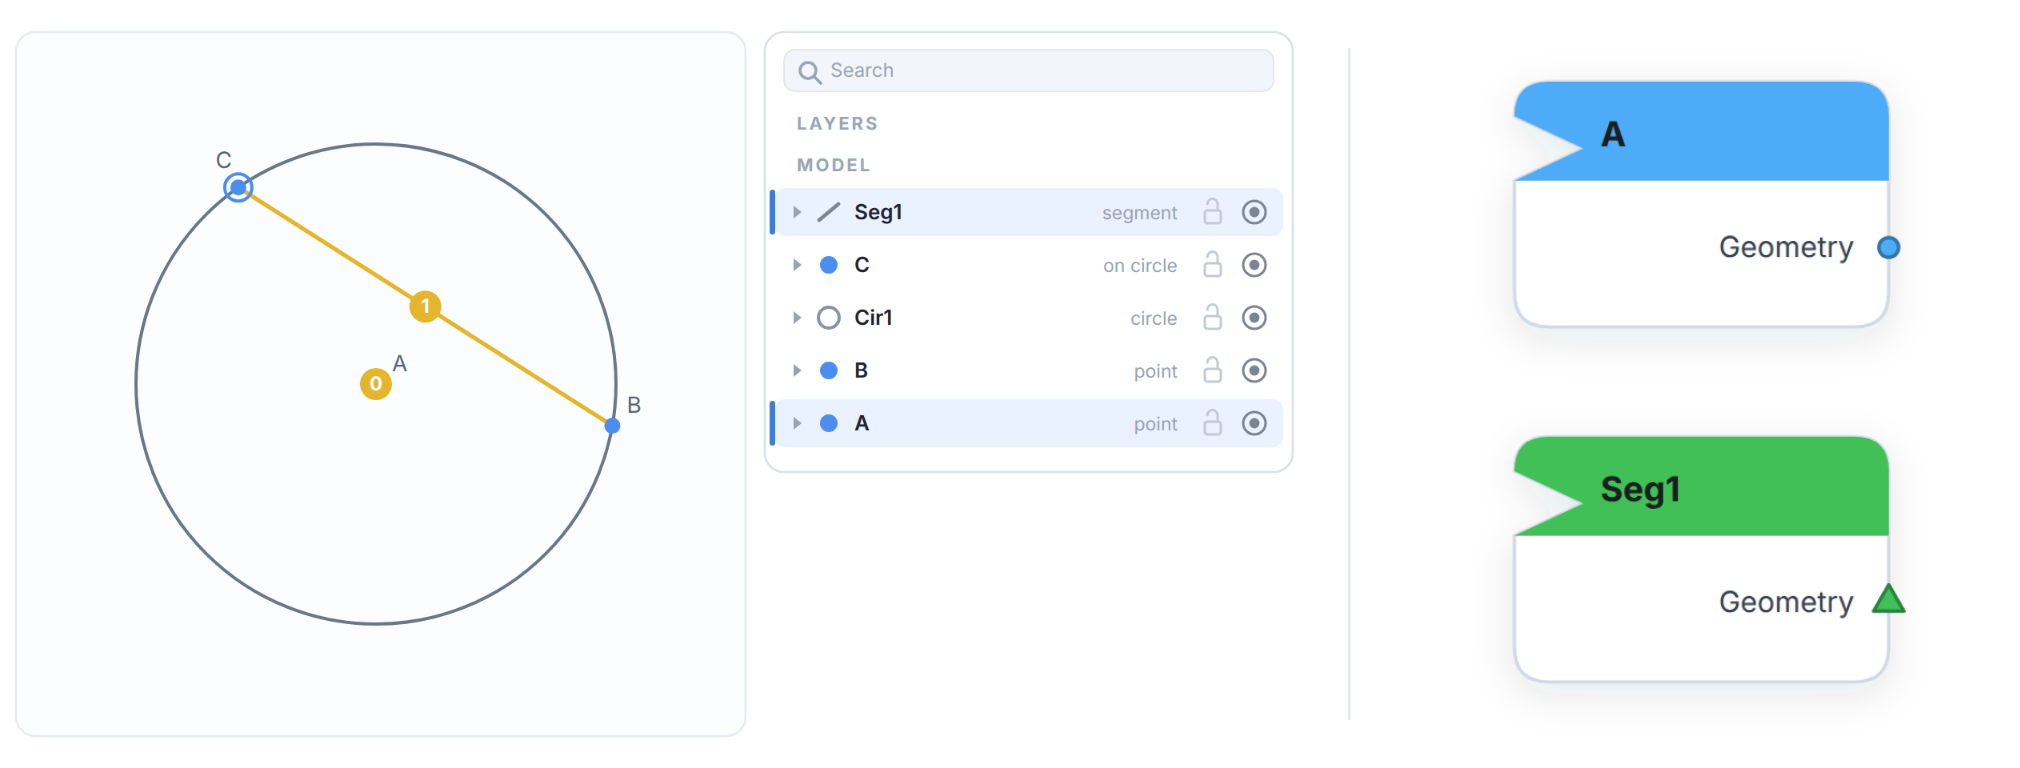
- Press Esc to clear your selection. Then Shift-click the circle's center point and the segment you drew, so both are selected.
- Choose Edit > Reference in Nodes. Two nodes appear in the Nodes window, one for each object. Each carries a small notch on its left edge - the mark that it came from the Modeling window. (These are Reference nodes: live pointers back to your construction.)
Tip
Click a Reference node in the Nodes window and its object lights up in the Modeling window - a quick way to be sure which construction object an input node points to.

- Click into the Nodes window, then choose Transform > Rotate to drop a Rotate node.
- Drag from the geometry socket on your segment's node into the geometry socket on the Rotate node. Then drag the center point's node into the Rotate node's center socket.
- Rotate spins the segment around that center point - by a set angle, repeated a set number of times - its Repeat value.
Note
Which way is positive? Angles here follow the sun across the sky in the hemisphere where this software was written: a positive angle turns clockwise, a negative angle turns counter-clockwise. This is the opposite of what you may remember from math class.
Click the Rotate node. Its result lights up in the Modeling window, so you can see the rotated copies. Double-click the node to change its angle and Repeat value, and watch the highlight update as you do.
Click off the node and the highlight disappears. That's the general rule: select any node at any time to preview its output, highlighted in the model - it's how you check what each step is producing.

- To keep a result visible even when nothing is selected, choose Display > Preview to add a Preview node.
- Plug the geometry flowing out of Rotate into the Preview node. The rotated copies now stay shown in the Modeling window on their own.
Go back to the Modeling window and drag one of your points. The circle resizes, the segment and its glider follow, and the rotated copies update right along with them - the whole chain stays connected, from the first point you placed all the way through the node graph.

Right now the Rotate node's Repeat value is a fixed number you edit by hand. A Slider turns it into a control you can drag - and because the whole chain is live, the pattern responds as you move it.
- Back in the Nodes window, choose Input > Slider to drop a Slider node.
- Double-click the slider's number to open its configuration, and set Value 3, Min 1, Max 10, Step 1 - a whole-number slider from 1 to 10, set to 3.
- Double-click the Rotate node and set its angle to 10 degrees.
- Drag from the slider's output into the Rotate node's Repeat socket.
- Now drag the slider. The number of rotated copies changes in real time - watch the copies appear and disappear in the Preview as you move it.
Everything upstream still applies: move a point in the Modeling window and the copies re-rotate around it; slide the value and the count changes with it - the construction, the node graph, and the slider are all one connected system.
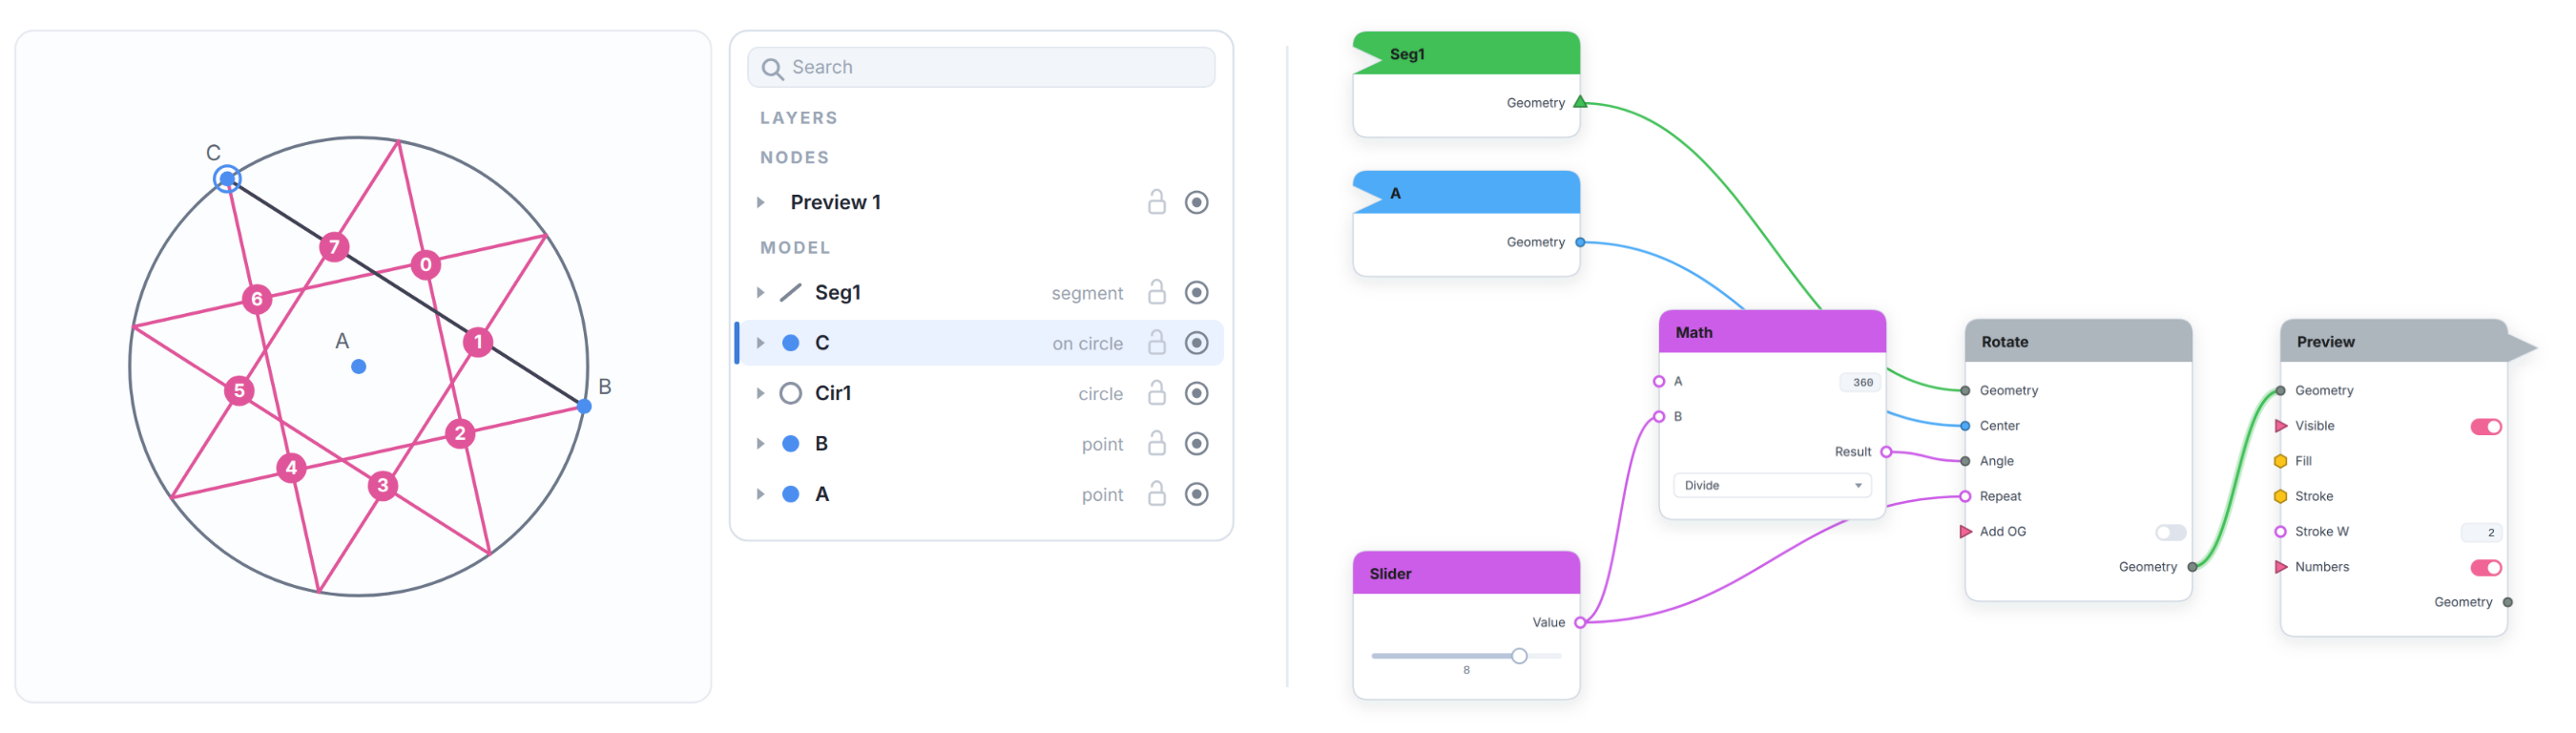
The slider sets how many copies you get - but at most values those copies don't evenly fill the circle. Let's fix that with a little arithmetic, and turn the whole thing into a small program.
The idea: a circle is 360 degrees. Divide 360 by the number of lines you have and you get the exact angle each line should rotate to land evenly all the way around. Eight lines -> 45 degrees each; twelve lines -> 30 degrees each. The node graph can do that math for you, live.
- In the Nodes window, choose Data > Math to drop a Math node.
- Set its top number to 360, and set its operation to Divide.
- Drag your Slider into the Math node's second number - the node graph is now computing 360 / (slider).
- Set the slider to 8, then hover over the Math node's output to check it: dividing the circle into 8 parts gives 45 degrees each.
- Drag the Math node's output into the Rotate node's angle socket.
Now the angle isn't a fixed number - it's computed from the same slider that sets the count. Drag the slider and the circle stays evenly full of lines at every value: more lines means a smaller angle, fewer lines a wider one, always filling the full 360 degrees.
Tip
If the on-canvas item numbers get in the way, switch off the Numbers toggle on the Preview node.
For extra fun, go back to the Modeling window and move any of your original points. The whole fan of lines tracks the change - the construction, the arithmetic, and the slider are all one connected system.
Congratulations - you just wrote a program. You described a relationship - the copies should always fill the circle, whatever the count - wired it up once, and now it holds no matter what you change. That's what building in the node graph is: not drawing a result, but describing how the result should behave.
Your fan of lines looks finished - but try to click one of the rotated copies in the Modeling window. You can't. They slide right past your cursor. Those copies are ghosts: a live preview of what the Rotate node is producing, not real geometry you can grab, measure, or build on. To bring them into the model for good, you Realize them.

- In the Nodes window, delete the Preview node - you're about to replace it with something that makes real geometry.
- Choose Display > Realize to drop a Realize node.
- Drag the Rotate node's output into the Realize node, and watch the Modeling window: a new group of geometry appears - solid this time, not ghostly.
Now go back to the Modeling window and click one of those lines. It selects, and the highlight trail lights up to show you where it came from: the group highlights, and back in the Nodes window the Realize node that made it highlights too. Select the Realize node and all of the realized geometry highlights at once - node and geometry are two ends of the same thing.
Because the realized lines are real objects, you can construct on them - draw a circle centered on one, pin a point to another - and those new objects stay pinned, tracking the realized geometry as your construction changes upstream.

Caution
Don't lean on this just yet. The realized geometry is remade every time the count changes - so anything you've built on top of it can be rebuilt out from under you, giving unexpected results when you drag the slider. Think of this as a preview of what's possible once you have more experience, not a foundation to build a finished pattern on today.
You've now gone the whole way around the circuit: a construction in the Modeling window, sent into the node graph, rotated, driven by a slider, shaped by a little arithmetic, and brought back into the model as real geometry. That's Locus Studio end to end.
< Previous: Interface tour | Next: Canvas basics >
- Community & support: ask questions, share your work, and get a license.